Facebook
 X
X
 Pinterest
 Copy Link


Due to the Stay Home, Stay Healthy orders being extended through May 4th, our annual Shred Event & Food Drive has been postponed to July 18, the first Saturday after the new income tax filing deadline. The safety of the attendees, our agents, staff and the public at large is our highest priority. We sincerely apologize for any inconvenience this may cause and look forward to seeing you in July!
This is our 9th year partnering with Confidential Data Disposal; providing you with a safe, eco-friendly way to reduce your paper trail and help prevent identity theft.
Saturday, July 18th, 10AM to 2PM
4211 Alderwood Mall Blvd, Lynnwood.
Bring your sensitive documents to be professionally destroyed on-site. Limit 20 file boxes per visitor.
We will also be collecting non-perishable food and cash donations to benefit Concern for Neighbors food bank. Donations are not required, but are appreciated.
**This is a Paper-Only event. No x-rays, electronics, recyclables, or any other materials.

As we head into week four of the Stay Home/Stay Healthy orders in Washington State, I turn my thoughts towards my gratitude for housing. It’s safe to say that over the last few weeks we’ve become quite intimate with our four walls, the brick and mortar that we call home. Concrete, steel, wood, and glass make up the structure that keeps us safe and protected, but it’s who and what is inside that makes it a home.
I don’t know about you, but I’ve never spent so much time in my home. This has developed a greater appreciation of the little things that make it special and even an acceptance of my not-so-favorite features. That quiet corner I can sneak away to, a blooming spring garden, a functional kitchen to create meals, and the community that surrounds us during a time of isolation are just a few items on my list of thank-yous. Our homes have become our sanctuaries, now more than ever. It goes beyond the sticks and stones that hold it upright; it is the heart in which our lives are pulsing.
I’ve always taken my role in helping people with their housing very seriously. To be asked to assist people in the purchase or sale of their home is an honor. The careful steps taken to protect liabilities and keen negotiations to ensure the highest and best value are very important components and ones I have a passion for. Now though, envisioning the connection one has or could have with a home is seen more deeply.
It is customary to have a list of features that one desires in a home and to pursue those features in the hunt for new housing or to celebrate them when selling. Buying and selling real estate is an emotional process and this experience has highlighted that connection more than I’ve ever realized before. Navigating finances is sensitive, but getting to the core of where you will spend your days or say good-bye to the place that housed you is meaningful. I’ve always seen real estate as a relationship business; while we do transactions that have a beginning and an end, the relationships are ongoing beyond the closing of a sale.
I wanted to take this time to say thank you for allowing me to be your trusted advisor when it comes to your housing. It means a lot to be a part of something so special and important in people’s lives. Also, just a reminder to please use me as a resource if you need any help maintaining your home. I have a list of reputable contractors and service providers that can help you care for your home should you have something break or want to make an improvement.
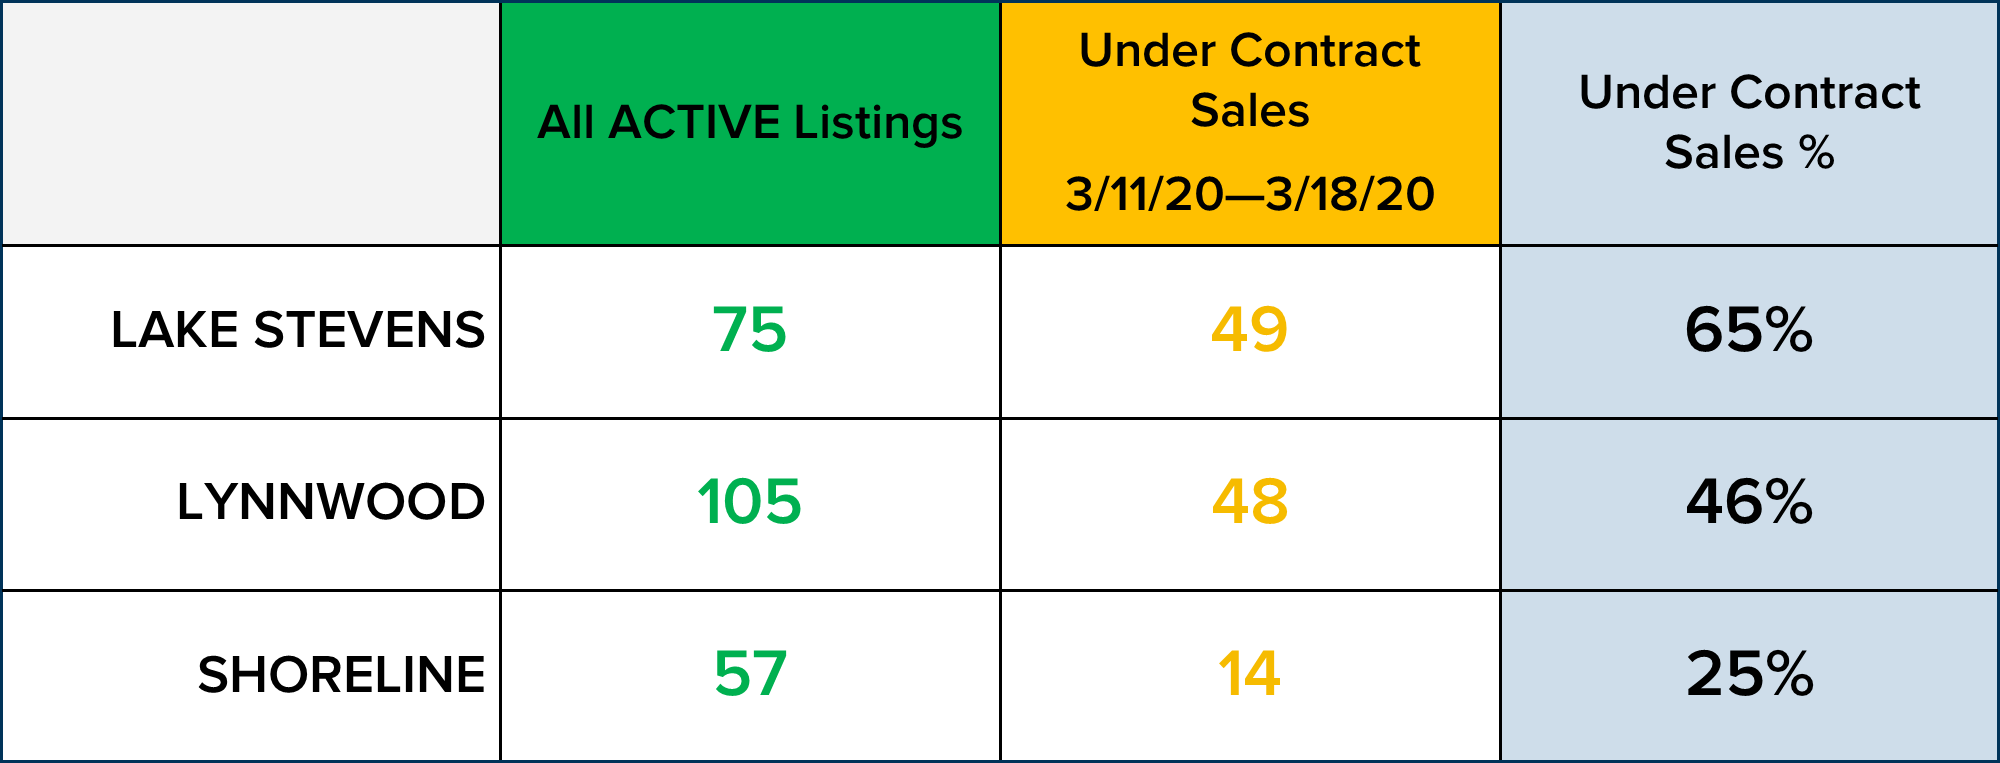
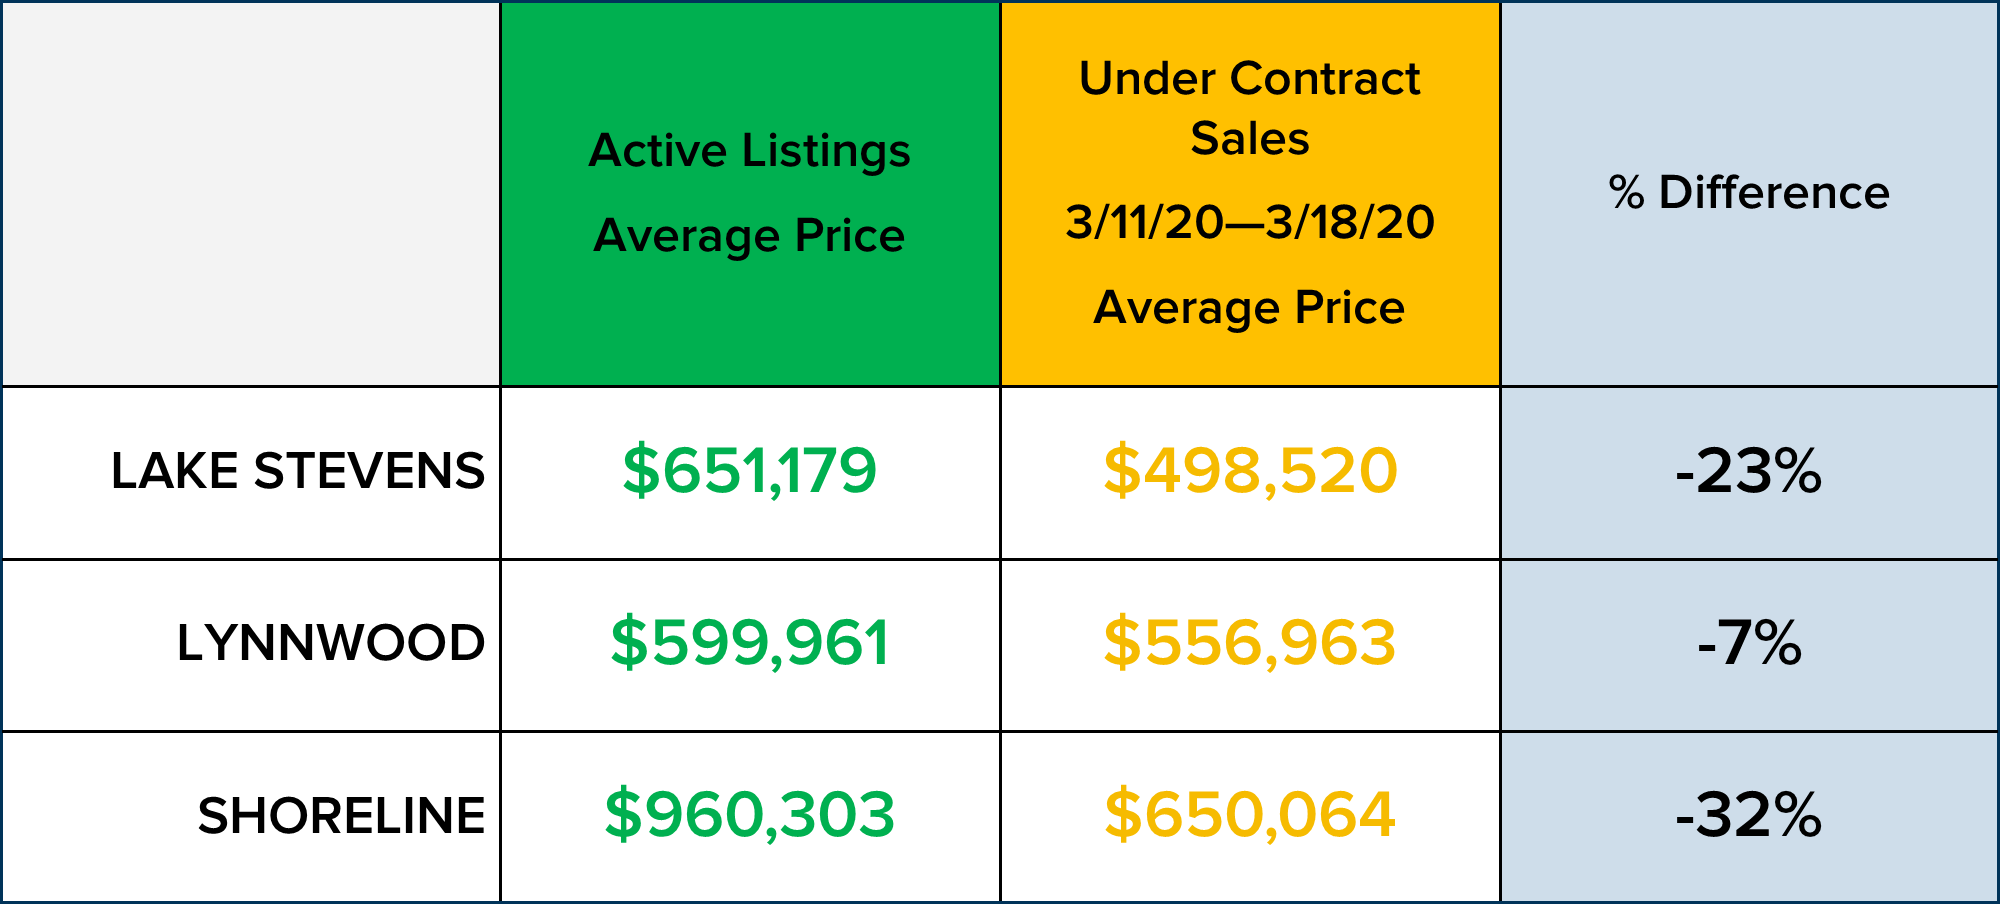
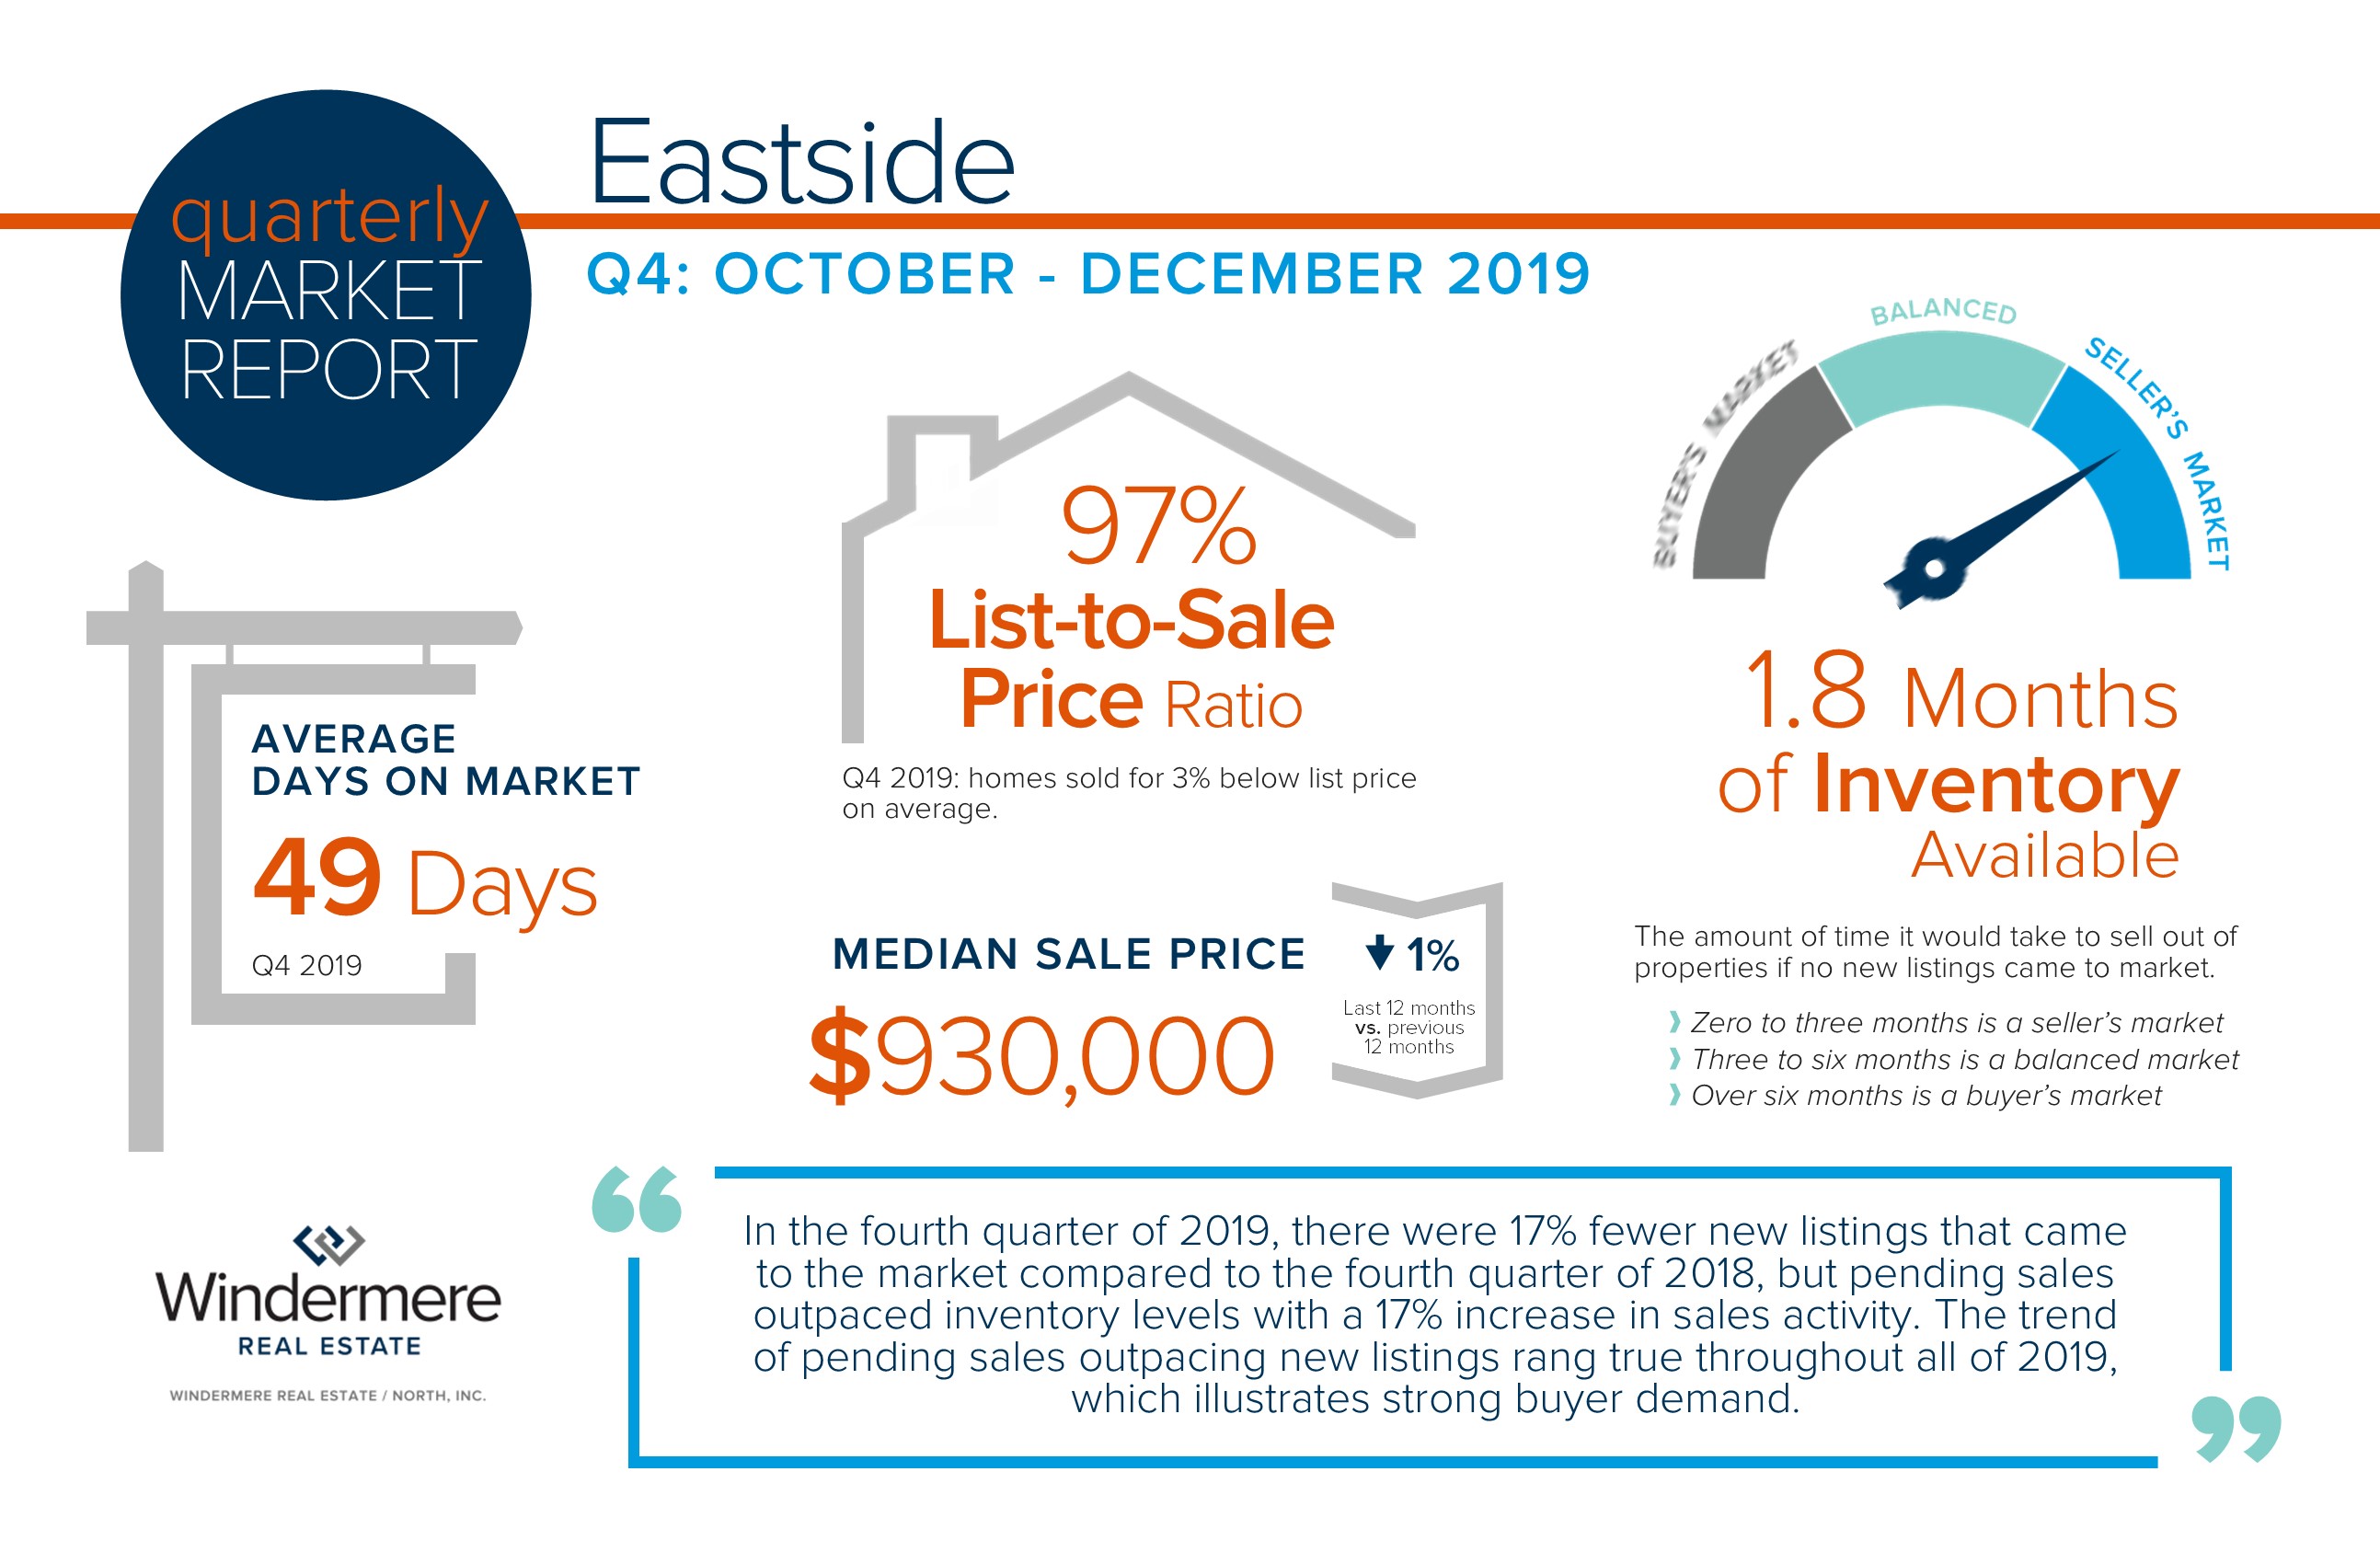
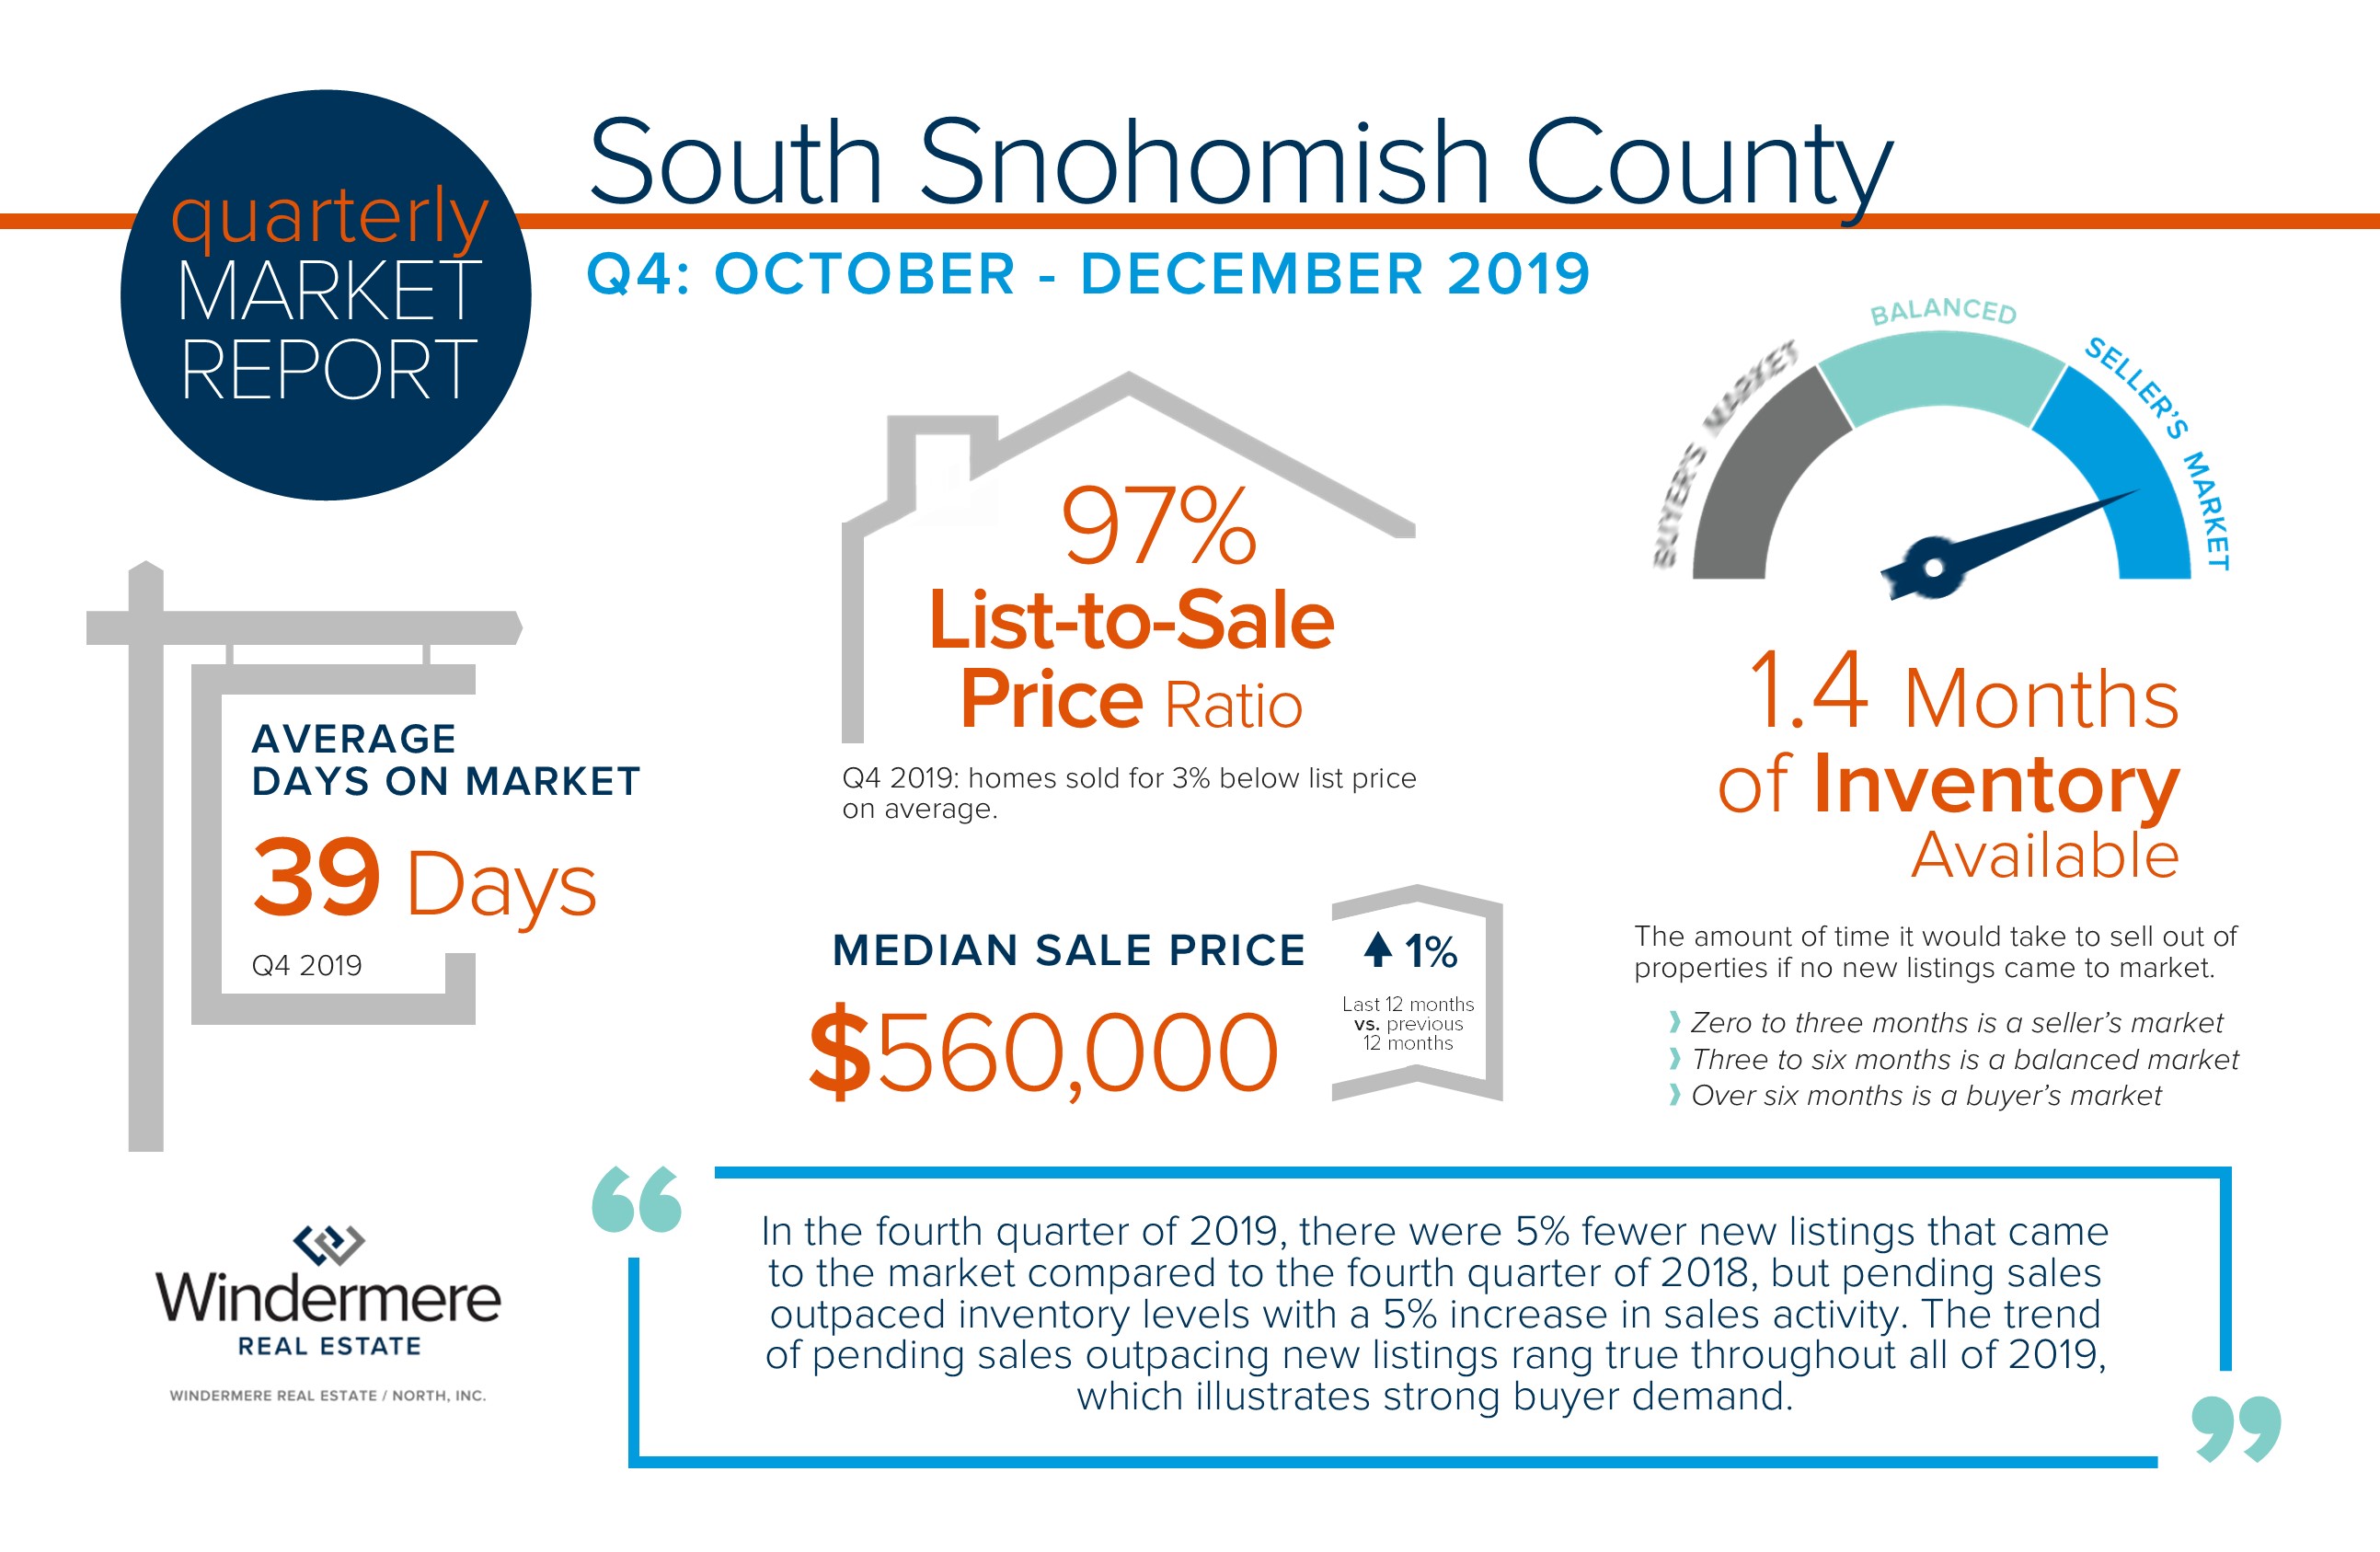
We’ve never navigated an environment like this before and I am committed to helping you stay informed. I’m happy to report that we are still seeing positive real estate activity happening during the Stay Home/Stay Healthy orders. My next newsletter, in two weeks will re-cap the latest statistics and will start to tell the more complete story of COVID-19 and real estate. We headed into this health crisis on the shoulders of a very strong first quarter in real estate and still have many positive economic influences in the PNW. I am certain there will be pent up demand on the other side of this historical time and I am hopeful many jobs will return. Stay tuned for this upcoming report and please reach out if you’d like to discuss now. In the meantime, I wish you and yours good health, a warm heart, and a happy home. Be well!