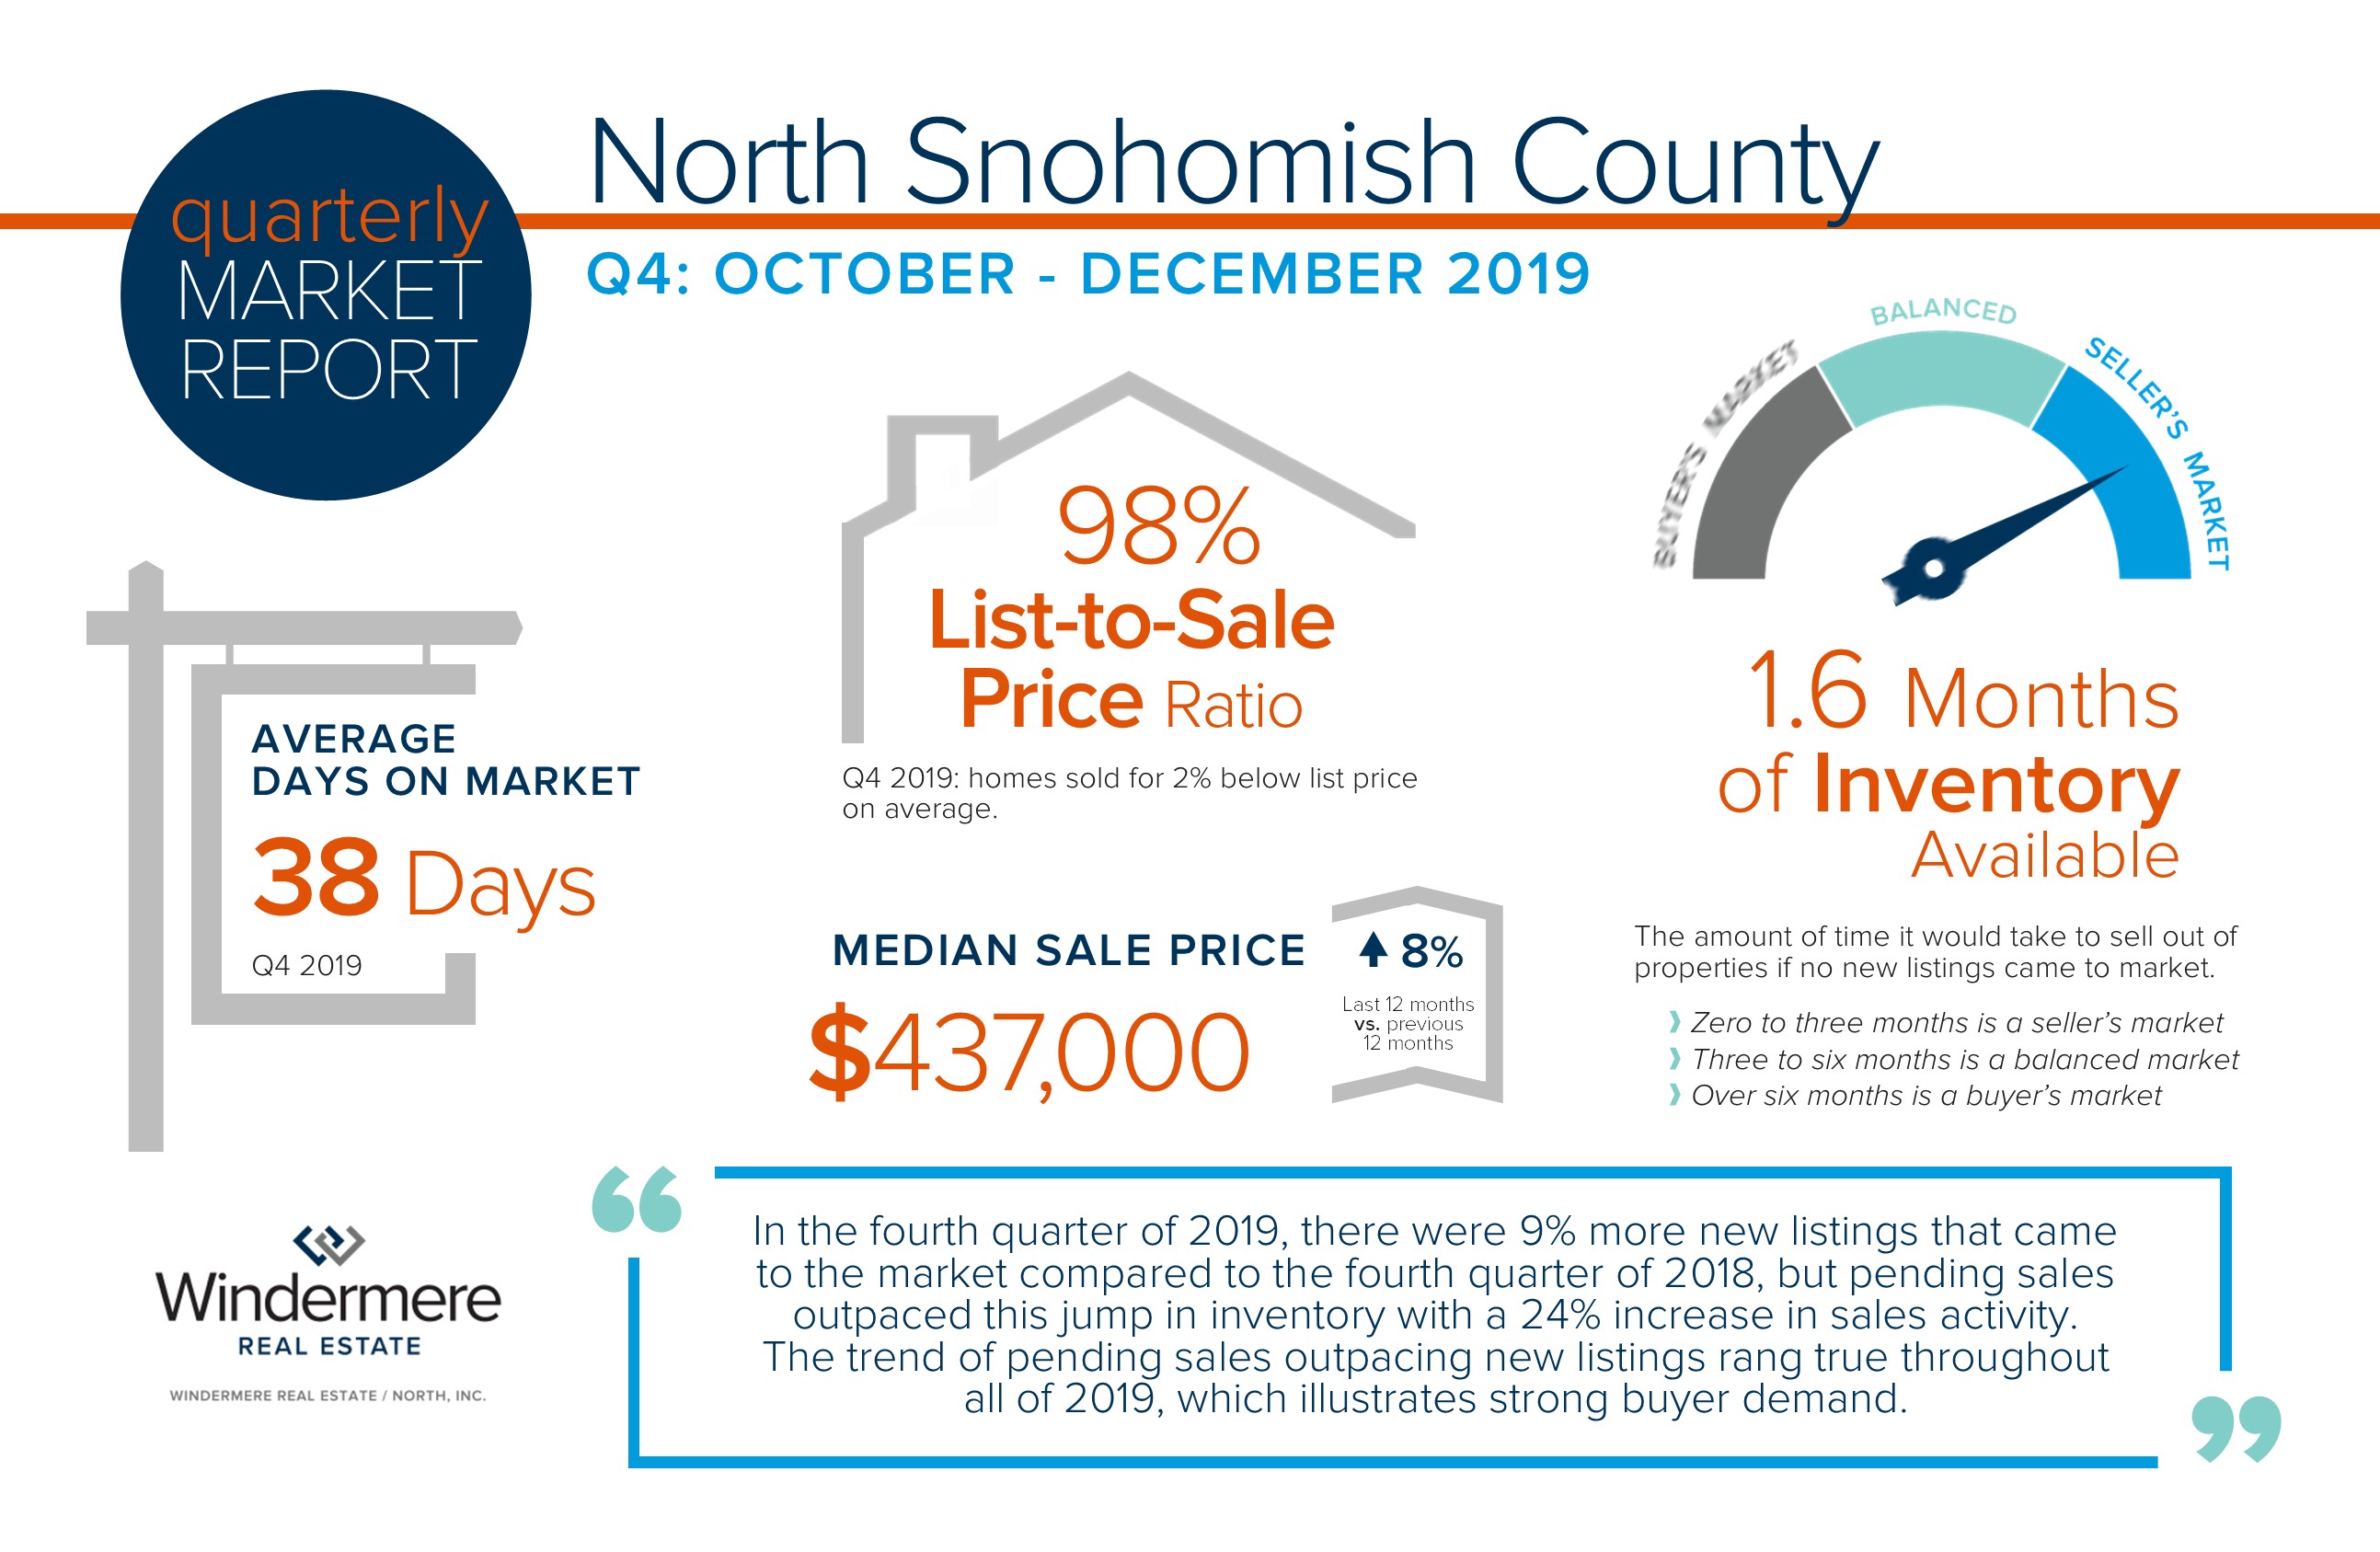
In the fourth quarter of 2019, there were 9% more new listings that came to the market compared to the fourth quarter of 2018, but pending sales outpaced this jump in inventory with a 24% increase in sales activity. The trend of pending sales outpacing new listings rang true throughout all of 2019 which illustrates strong buyer demand. This demand is being fueled by the lowest interest rates we have seen since 2016, additional job creation in our area, and the convergence of baby boomers making big lifestyle moves and millennials making their first home purchases. Equity levels are very healthy for many homeowners due to the last 8 years of price growth, providing the opportunity to make that right-size, move-up, or move-out-of-the-area move. An important factor to note as we head into Q1 of 2020 is the tighter-than-normal inventory levels. This will bode well for sellers, as buyers are anxious to secure a purchase with these historically low interest rates. Low interest rates are a benefit for buyers to have lower debt service, but also affords home sellers a larger audience.
This is only a snapshot of the trends in north Snohomish County; please contact me if you or someone you know would like further explanation of how the latest trends relate to your housing goals.
2019 was a return to normalcy in the real estate market. After a volatile 2018 which encountered a sharp mid-year shift from an extreme seller’s market, 2019 had a more normal pace of seasonality and selection. After four to five years of multiple offers, week-long market times, waived inspections, and huge price escalations, we’ve now experienced a balancing out in price appreciation and in some areas, a correction.
Affordability and inventory have driven demand. A healthy increase in homes coming to market compared to two years ago has provided more selection and afforded buyers time to decern their choices. In-city prices found an affordability cap as buyers were forced to move north or south to find the payment they could afford. Close-in, in-city neighborhoods saw a bit of a price correction due to demand slipping for this reason. Overall, it’s been a welcome change to help buyers and sellers operate in a more balanced environment.
It’s important to understand that each market area has its own unique circumstances. Above and throughout this review, I divided the Greater Seattle area into 6 different market areas in order to illustrate this.
This chart is a study of the comparison of new listings to sold listings, which indicates demand. Over the last 12 months in each market area, sold listings have outpaced new listings. While some areas experienced more new listings from the same 12 months the year prior and some less, in each area the sold listings moved at a higher level than the previous 12 months. This is encouraging, as it shows that demand for our area is still very high.
This is driven by having one of the leading national job markets and continued low interest rates. One of the factors that affected the 2018 market shift was higher interest rates. The majority of 2018 rates were in the 4’s and almost reached 5% in late fall. In 2019, we started at 4.5%, and currently sit around 3.7% according to Y charts. In fact, since June we have remained under 4%. This has helped curbed affordability issues, brought first-time buyers out in force, and helped buyers that are also sellers move equity with low debt service. Believe it or not, experts are predicting rates will remain low throughout 2020. This is a key factor for consumers to pay attention to if they plan to jump into the market.
Above is a look at the new normal for market times and list-to-sale-price ratios. On average, it simply takes longer to sell your house now compared to the constricted, extreme seller’s markets of 2016-2018. The expectation of your home selling in the first weekend needs to be tempered, as the playing field of inventory has equaled due to more new listings coming to the market.
There is a phenomenon of Baby Boomers cashing out their equity and downsizing or moving out of the area. This is providing great move-up inventory for Gen X and Millennials to absorb. That absorption is then providing a nice selection of first-time-homebuyer houses. Bear in mind however, that the lower price points are where we are seeing the strongest demand, shortest market times, and stronger price appreciation. It’s a pretty awesome cycle to witness!
Sellers have had to negotiate a bit more, whether on the initial offering or during the inspection period. List-to-sale price ratios indicate that buyers and sellers are engaging in the dance of negotiations as prices return to a more normal level of price appreciation. Sellers on average are still getting very close to their list price. Since these are the averages, you must realize that there are still sellers that are escalating.
Homes that come to market with a well-thought-out pricing strategy, in great condition, and expertly merchandised are the ones we see breaking the average. Also, the influx of first-timers has helped drive demand in the lower price points, curtailing days on market and tighter list-to-sale price ratios in that section of the market.
When analyzing price appreciation, it is important to use a large data pull. For example, the chart above takes the last 12 months of prices and compares them to the previous 12 months. This provides a much more holistic observation of price growth versus a smaller data pull, such as month over month. Take note that the media often uses month-over-month data to paint a more dramatic story.
As mentioned above, the close-in, in-city markets have experienced a correction. It is clearly more expensive to live where you have a shorter commute to major job centers. Also, on the Eastside where the prices are the highest, they enjoy close proximity to some of the area’s biggest employers and arguably some of the best school districts in the area. The more out-lying communities found in south King and all of Snohomish County continue to see steady appreciation due to still-manageable commute times and affordability. The north Snohomish County market has been a hotbed for first-timers and Baby Boomers moving out of the area due to retirement and commutes not being a factor.
Note that this data pull is a complete year-over-year look at December 2018 to November 2019 compared to December 2017 to November 2018. Bear in mind that the first half of 2018 was an extreme seller’s market with sparse inventory and crazy escalations. This is where prices found their peak, and as we move away from those unique months and head into 2020, I believe that we will see the decrease in appreciation equal out and possibly have some subtle growth.
The chart above is a study of the months of inventory. This illustrates how quickly we would sell out of homes based on demand if nothing new came to market. We are calling the 2019 market a more normal market, but in reality, it was still measured as a seller’s market (0-3 months of inventory). It just hasn’t been so extreme, which has created a mentality that needs to be adjusted.
Just like the pricing study above, the data from the first half of 2018 included some markets that had only weeks of inventory versus months. That feels wildly different and takes some getting used to. Some may argue that the new normal of measuring a seller’s market is now 0-2 months, and that 2-4 months is a balanced market. Perspective is driving that viewpoint, as we have an entire portion of consumers that have known nothing besides historically low interest rates and low inventory levels. The vantage point of what is actually normal is finding its footing.
Right now, all six markets sit at a lower inventory level than the average of the year. This is due to seasonality. Many sellers prefer to come to market when the days are longer and we are outside of the holidays. I predict that the low interest rates and the turn of the new year will encourage strong buyer demand. New Year’s resolution goal setting always brings demand. With that said, the sellers that come to market earlier in the year prior to the spring rush will enjoy a large audience hungry for inventory to gobble up.
Overall, 2019 has been a very positive year in real estate. The majority of the sales have been propped up on incredibly favorable equity positions on behalf of sellers and historically low interest rates for buyers. If a person has owned their home for 3 or more years and hasn’t cashed equity out, they are in a positive equity position. For those that have been in their homes for 10 or more years, they are knocking it out of the park!
Below you can watch a short video from Matthew Gardner, Windermere’s Chief Economist, and hear what he thinks we have in store for 2020 on the national level. As we head into the New Year, please reach out should you have a curiosity about how your local real estate market relates to your financial and lifestyle goals. It is always my goal to help keep my clients informed and empower strong decisions through thorough research and a high level of communication.
Here’s to a happy holiday season and a prosperous 2020!
It’s that time of year when Windermere Real Estate’s Chief Economist Matthew Gardner dusts off his crystal ball and peers into the future to give us his predictions for the 2020 economy and housing market.
Holiday Giving!
This Christmas, my office adopted 23 foster boys, ranging in age from 13-18 years old, and living in group homes managed by Pioneer Human Services. These group homes serve boys who are struggling with emotional, behavioral and/or psychiatric problems that prevent placement in a traditional foster care setting. We purchased gifts, using wish lists from the boys, to help provide a joyful Christmas morning for these teenage boys who might otherwise be overlooked.
The office also raised money for grocery gift cards for families in need (also referred by Pioneer Human Services). This year we distributed $3,538 in grocery gift cards to 12 local families.
We are also thrilled to report that we were able to deliver a full car load of warm winter donations to Mary’s Place from all of your generous donations during our Thanksgiving pie giveaway and Santa photo events.
Because big parties with crowds, expensive cocktails, and massive fireworks shows aren’t the only way to ring in the new year.
The holiday season is in full swing, and the year (and the decade!) is almost over. If a big party is not your scene, you’re not alone. Some of the most fun and meaningful moments in life are a little more intimate, and shared with people we love. Below, I’ve rounded up a few ideas for ringing in the new year that are a little off the beaten path.
Staying In
Dinner Party
Invite your favorite people to share a meal. Plan an elaborate menu, and go all-out fancy. It’s the end of a decade, after all. Not much of a cook? Plan a potluck instead. Challenge everyone to make something they wouldn’t normally cook. Or assign teams and host a cook-off competition. There are lots of possibilities, but the end result of spending the evening with those you love, reflecting on the past and planning for the future is always a win.
Game Night
Gather the gang for drinks, snacks, and some good-natured smack talk. Game nights provide an easy way to laugh, play, and get out of your comfort zone, together. To avoid a game night fail, make sure you think about these three questions: 1) How many people can comfortably fit in your space 2) How many people can play the games you want to play 3) What kind of group do you want to have?
There are tons of great games you can play together, but here are some ideas, broken down by category. May the best player win!
Wine Tasting
Invite a local wine expert and a few friends to a special NYE tasting. Or, choose a type of wine and a price-point, and have everyone bring a bottle. Whether you are supplying the wine, or leaving it up to your guests, you’ll need to make sure you have enough wine glasses and a couple of good corkscrews, as well as plenty of food to soak it all up. Here are some great tips and ideas for hosting a great tasting.
If wine isn’t your thing, you could host a tasting event with beer, chocolate, or a different food item you love!
Pajama Party
If you’d rather have a low-key, casual evening at home, throw a pajama party! Cocktails, appetizers, and jammies were definitely meant to be together! You could make it a girls night in, a sleepover, a movie marathon, a family affair… so many possibilities! To make the evening feel extra special, have a signature cocktail for the evening. Perhaps something with champagne? Plan lots of snacks, gather all the throw blankets and pillows you can find, and get cozy.
Out & About
Overnight Hotel Stay
Take a mini vacay! It could be a fun getaway for the family, a renewing solo adventure, or the ultimate date night. During the day you can do some shopping, go see a movie, take advantage of the hotel pool, or relax in the spa. Ring in the new year with a meal in the hotel restaurant, or order room service for a special treat.
Attend a Religious service
Also called a Watchnight Service or Mass, the late-night New Year’s Eve religious service is a wonderful opportunity for self-reflection, renewal and preparing for the year ahead.
Volunteer
Spend the day volunteering your time for a worthwhile cause that is important to you. Perhaps there is a homeless shelter in your city who is looking for help serving dinner. Or a nursing home nearby, full of people who could use a friendly visitor. Make it a family day, or ask a few friends to join you. Spending time serving others can be one of the most rewarding ways to close out the year.
Karaoke!
For a casual, fun-filled evening with friends, ring in the new year with singing, drinks, laughter, and fun. If you like the idea of karaoke, but you’re too shy to sing in front of strangers, rent a private karaoke room so only you and your closest friends can laugh at each other.
No matter how you decide to close out the year, choosing to spend your time with people you love will ensure that you have a holiday worth remembering.
I am pleased to present the third-quarter 2019 edition of the Gardner Report, which provides insights into select counties of the Western Washington housing market. This analysis is provided by Windermere Real Estate Chief Economist Matthew Gardner. I hope that this information will assist you with making better-informed real estate decisions. For further information about the housing market in your area, please don’t hesitate to contact me.
As winter approaches, it’s time to make sure your home is ready for the harsh weather ahead. To avoid costly repairs later, take some time now preparing your home to withstand another cold season. Here are 30 important tasks to protect and prepare your investment. View the full list here.
Have you been keeping track of the Seahawks home game defensive tackles? We have. Every one means another $100 donated to Mary’s Place. After the last home game win against Tampa Bay, our total raised to date is $118,100. Every play matters in the fight against homelessness! Follow along on social media with #tacklehomelessness. Go Hawks!
Kick off the holiday season with a community tree lighting celebration. Thanksgiving falls late on the calendar this year, so the Christmas festivities will be right on it’s heels. Some of these celebrations start as early as the day after Thanksgiving!
The bigger celebrations feature Santa’s arrival, and most of the communities will have fun activities designed to put you and your family in the holiday spirit. live music, refreshments, crafts, and other fun activities. Santa will make an appearance at most of these as well.
Last month, I did an analysis on the new phenomenon of a dual market. A dual market is when you have different market conditions within the same overarching real estate market. This duality presents amazing opportunities for sellers who are also buyers, depending on where they want to go. I reported on two dual markets, the move-up market and the move-out market. Another dual market that deserves to be shared is the condo market compared to single-family residential.
In September, single-family residential homes in Seattle Metro had an absorption rate of 43% while condos were at 27%. Months of inventory based on pending sales for single-family residential was only 1.9 months of available inventory, and condos, 3.5 months! That is the difference of a seller’s market for single-family residential to a balanced market for condos. After many solid years of strong appreciation, folks that are looking to cash out the equity on their single-family residential homes and move to a condo have the opportunity to move their investment with a sizable down payment and upgrade to a lifestyle that is often stair-free with less maintenance.
The median price for a condo in Seattle Metro in September was $455,000 and for a single-family residential home, $750,000. The median price for a condo in south Snohomish County is September was $343,000 and for a single-family residential home, $569,000. It is common for folks to sell their long-time family home and downsize into a condo and pay all cash. The buildup of equity over the years and paying down their loans allow for large cash-outs and easier all-cash purchases.
If one is getting a loan though, it is important to highlight today’s interest rates. They are a point lower than they were a year ago, affording buyers 10% more buying power. For example, a one-point-lower rate on a purchase at $500K will now afford a buyer the purchase of a home at $550K with the same monthly payment. Couple that with price appreciation tempering and you have a perfect downsizing market, which often includes condo purchases!
If you are curious about moving from a single-family home to a condo and the opportunity this dual market presents, please reach out. It is my goal to help keep my clients educated and empowered to make strong decisions. This is especially rewarding when it leads to their next chapter in life, which are amazing transitions to be a part of.
Did you know that giving thanks on a daily basis can reduce your trips to the doctor, increase your overall happiness, improve personal relationships, and lead to more exercise? Sounds like a magic pill to me, and it’s free! Harvard Medical School recently released a study that speaks to the benefits of practicing gratitude. With Thanksgiving approaching, challenge yourself to write down your gratitudes daily, and see how it goes.
It’s true! A listing agent’s goal is to get their listing sold to a qualified buyer who will close. However, a good listing agent also realizes that once a home is under contract, they now have to sell the house to the appraiser if the buyer is getting a loan. You see, a buyer cannot complete their financing if the appraisal does not come in at the same value or higher than the agreed-upon contract price. A good strategy, especially if the price escalates above the list price, is for the listing agent to prepare an appraisal packet and meet the appraiser or share it with them via email. This gives the listing agent the opportunity to share their research and the story of the demand surrounding the property. This is some extra effort, but so worth it to ensure success for the seller!
Increased pending activity is an indication of strong buyer demand which is very much being driven by historically low interest rates, a thriving job market, and an overall strong local economy. In fact, interest rates are an entire point lower than they were a year ago! This affords buyers a price point that is 10% higher over last year while maintaining the same monthly payment. A year ago, the monthly payment for a home at $500,000 is the same for a home at $550,000 today. Today’s rates coupled with tempered price appreciation provides increased affordability for buyers, which in turn is providing a healthy audience for sellers. After many years of strong price increases, many sellers are moving their equity to the next lifestyle home they desire.
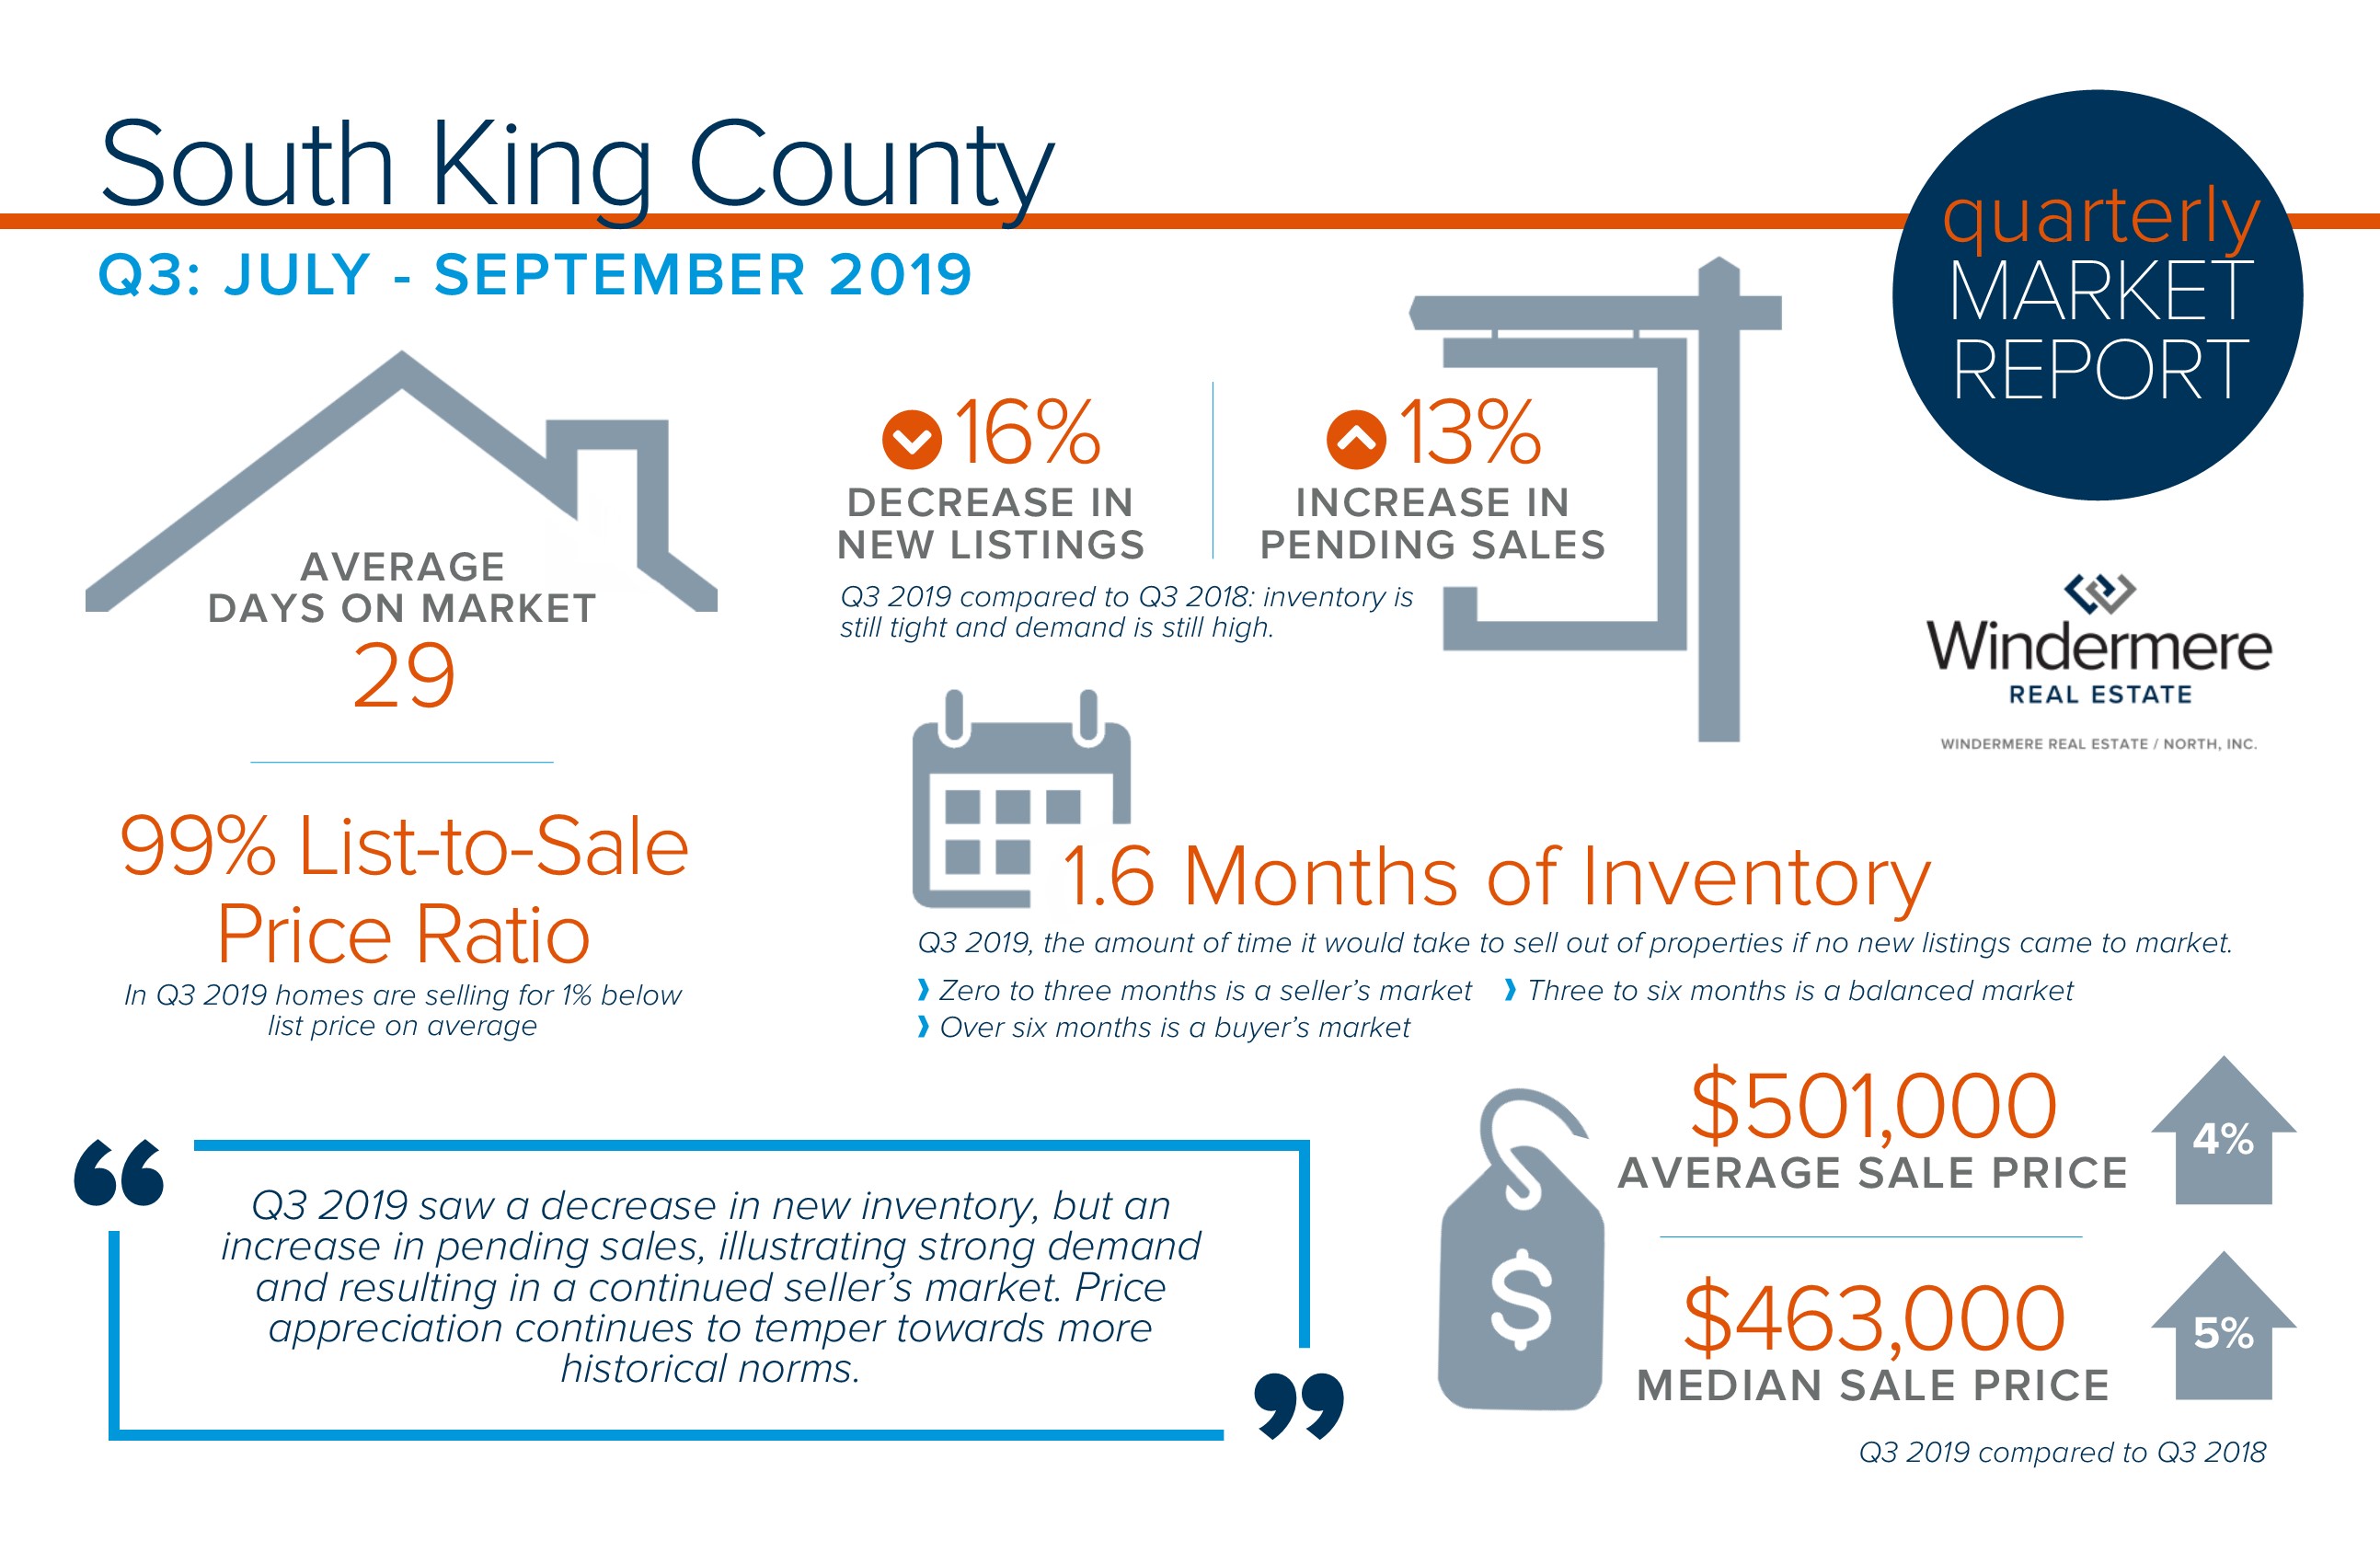
This is only a snapshot of the trends in south King County; please contact me if you would like further explanation of how the latest trends relate to you.
Increased pending activity is an indication of strong buyer demand which is very much being driven by historically low interest rates, a thriving job market, and an overall strong local economy. In fact, interest rates are an entire point lower than they were a year ago! This affords buyers a price point that is 10% higher over last year while maintaining the same monthly payment. A year ago, the monthly payment for a home at $450,000 is the same for a home at $495,000 today. Today’s rates coupled with tempered price appreciation provides increased affordability for buyers, which in turn is providing a healthy audience for sellers. After many years of strong price increases, many sellers are moving their equity to the next lifestyle home they desire.
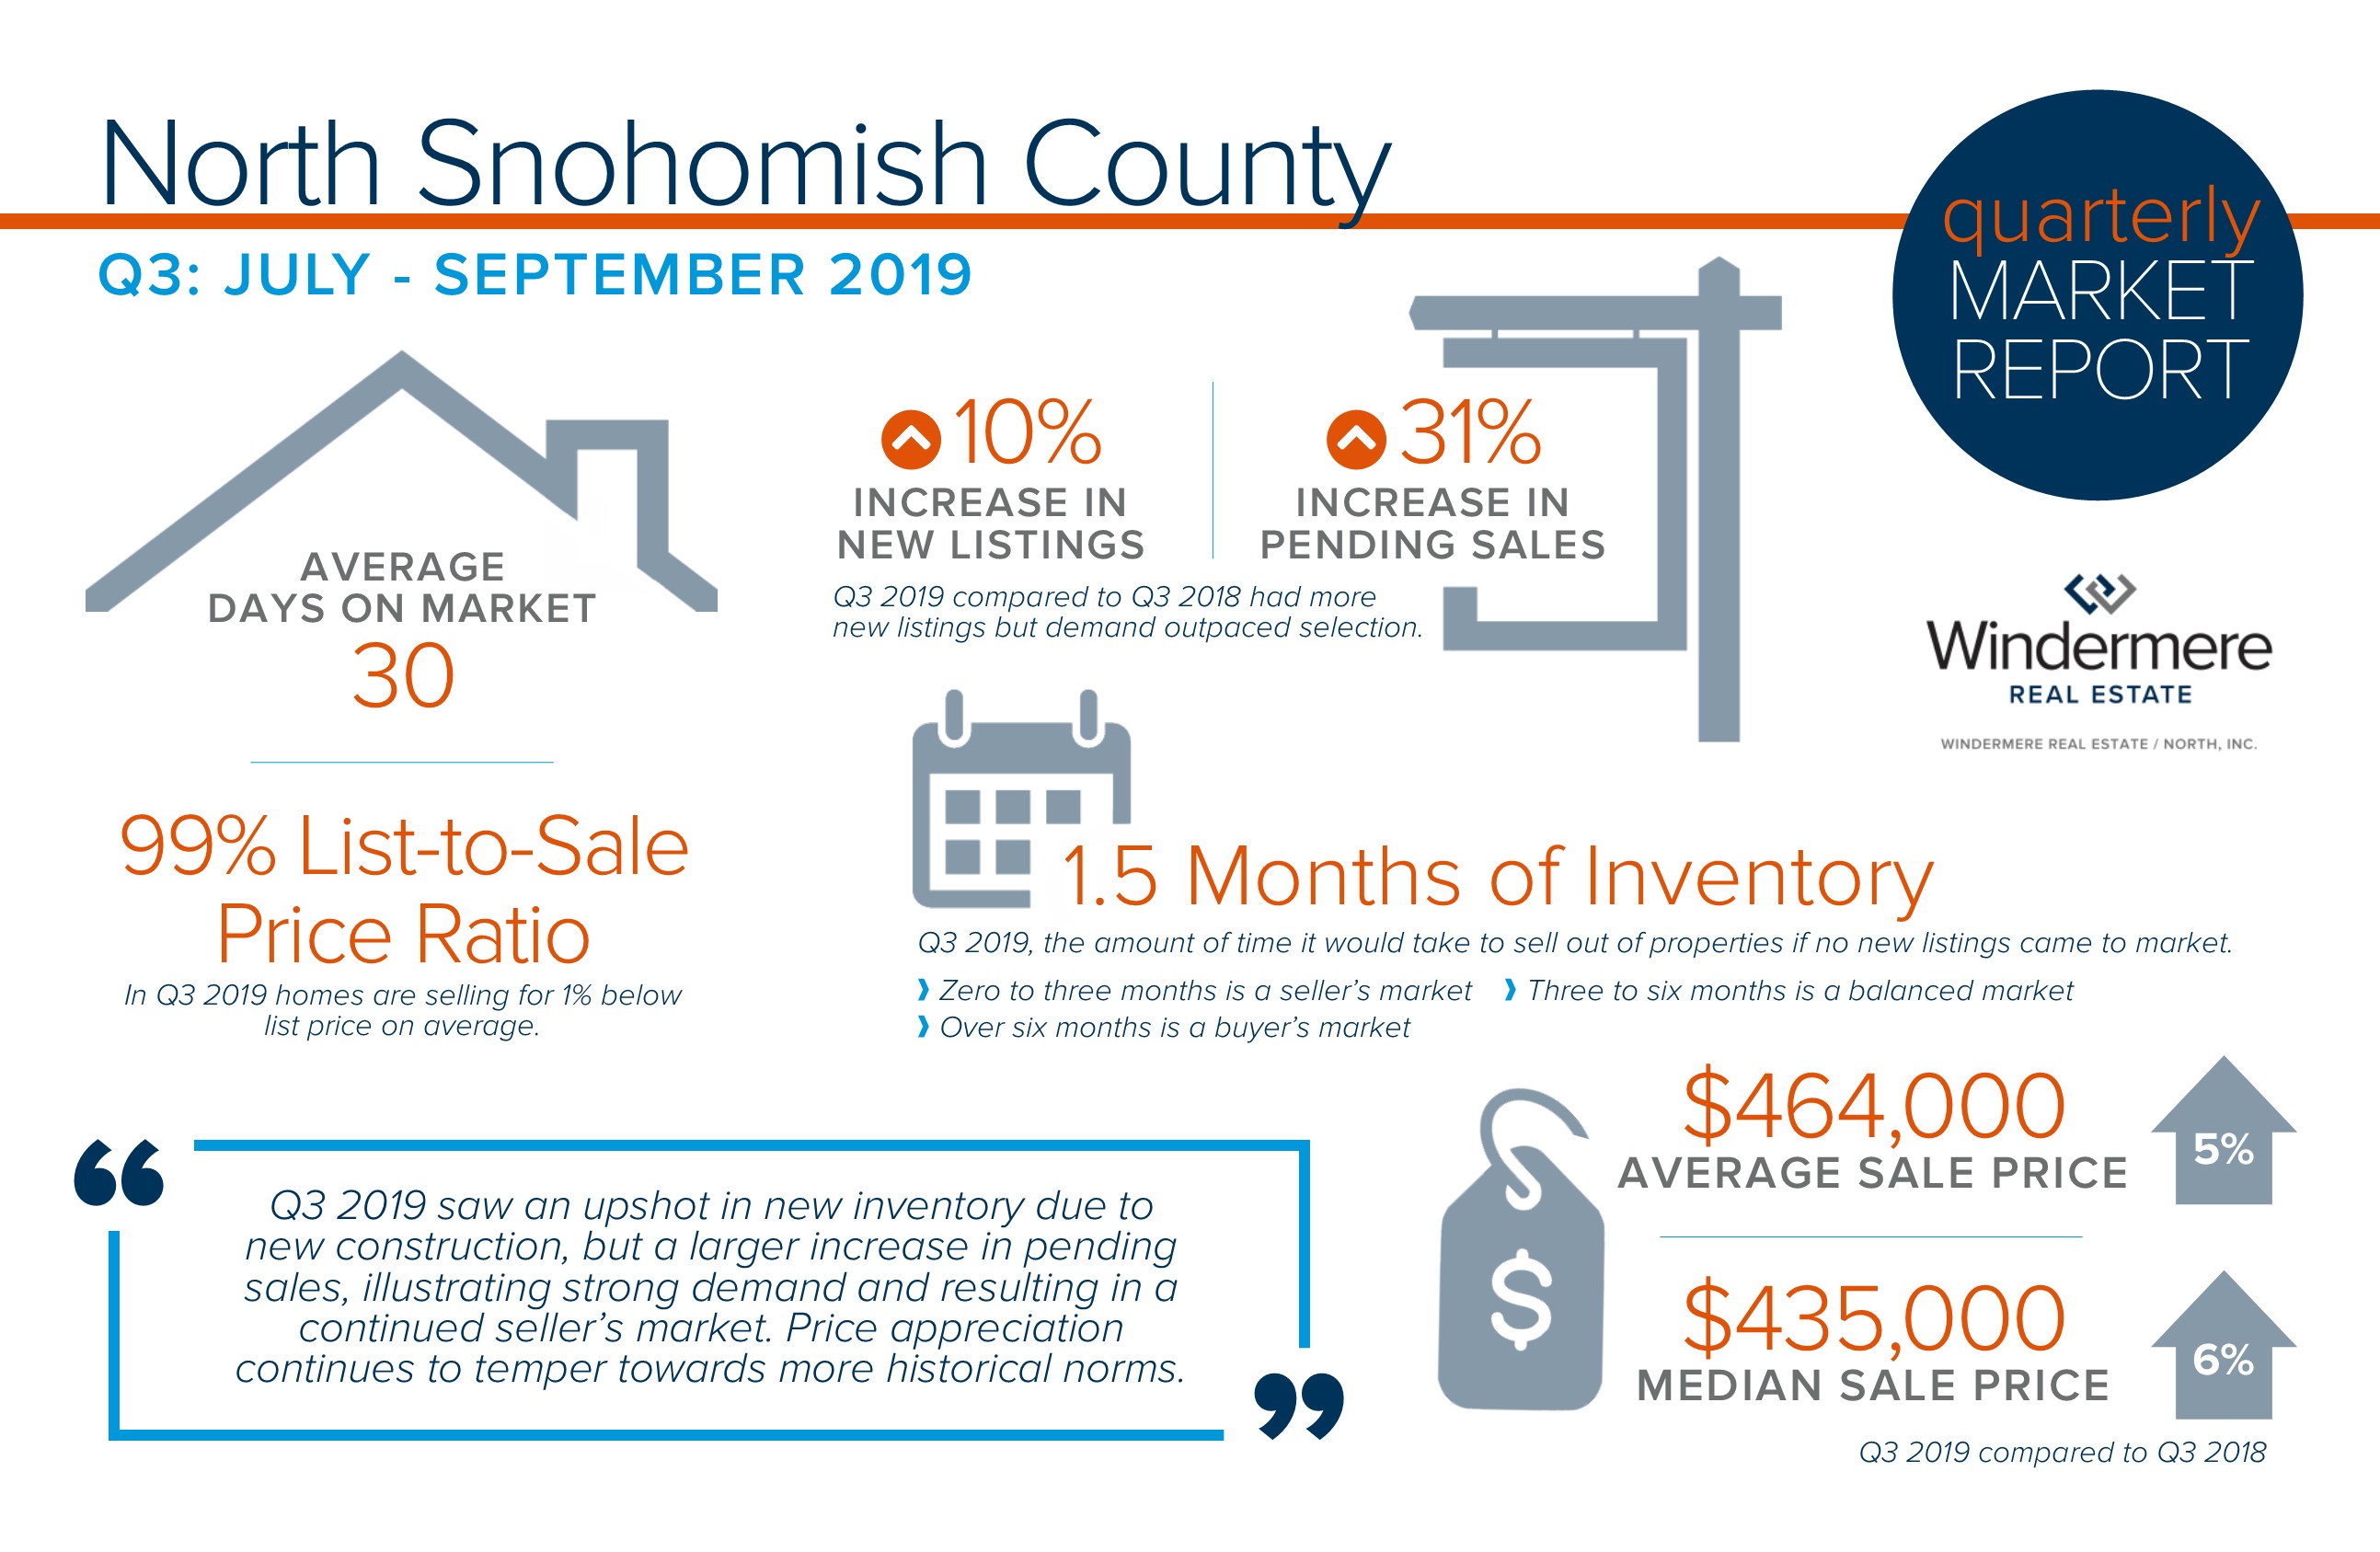
This is only a snapshot of the trends in north Snohomish County; please contact me if you would like further explanation of how the latest trends relate to you.
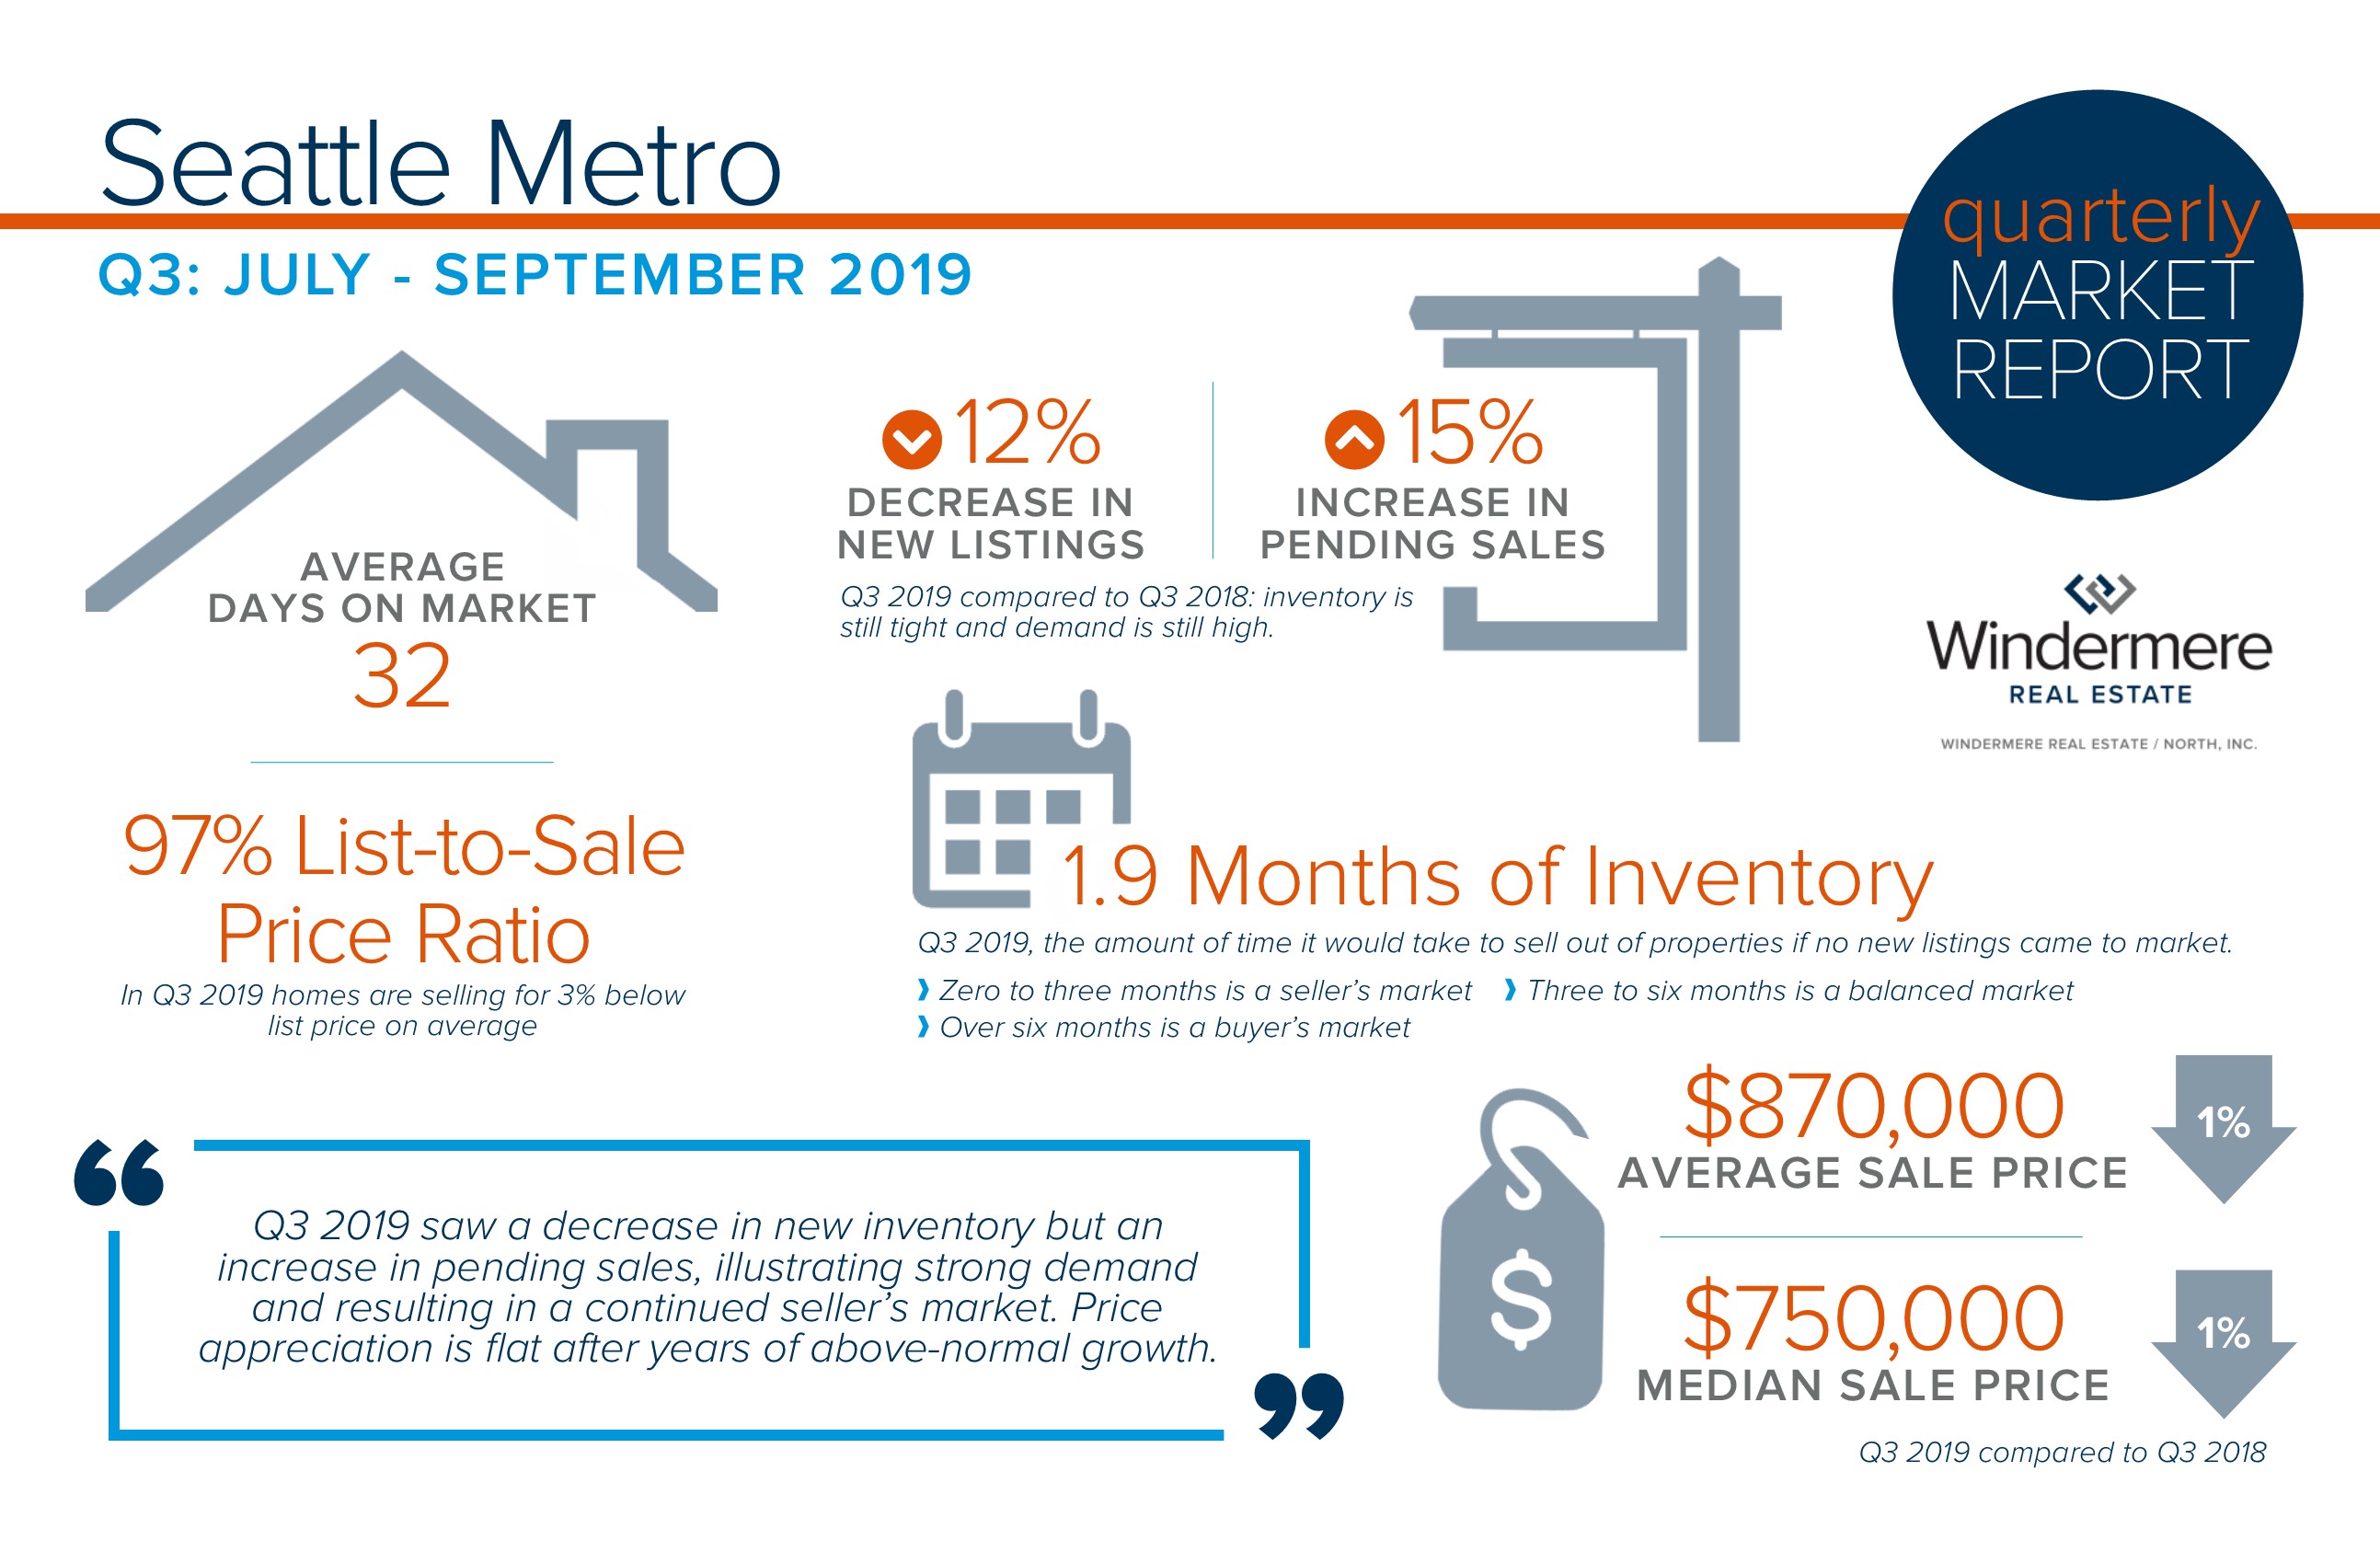
Increased pending activity is an indication of strong buyer demand which is very much being driven by historically low interest rates, a thriving job market, and an overall strong local economy. In fact, interest rates are an entire point lower than they were a year ago! This affords buyers a price point that is 10% higher over last year while maintaining the same monthly payment. A year ago, the monthly payment for a home at $750,000 is the same for a home at $825,000 today. Today’s rates coupled with tempered price appreciation provides increased affordability for buyers, which in turn is providing a healthy audience for sellers. After many years of strong price increases, many sellers are moving their equity to the next lifestyle home they desire.
This is only a snapshot of the trends in the Seattle Metro area; please contact me if you would like further explanation of how the latest trends relate to you.
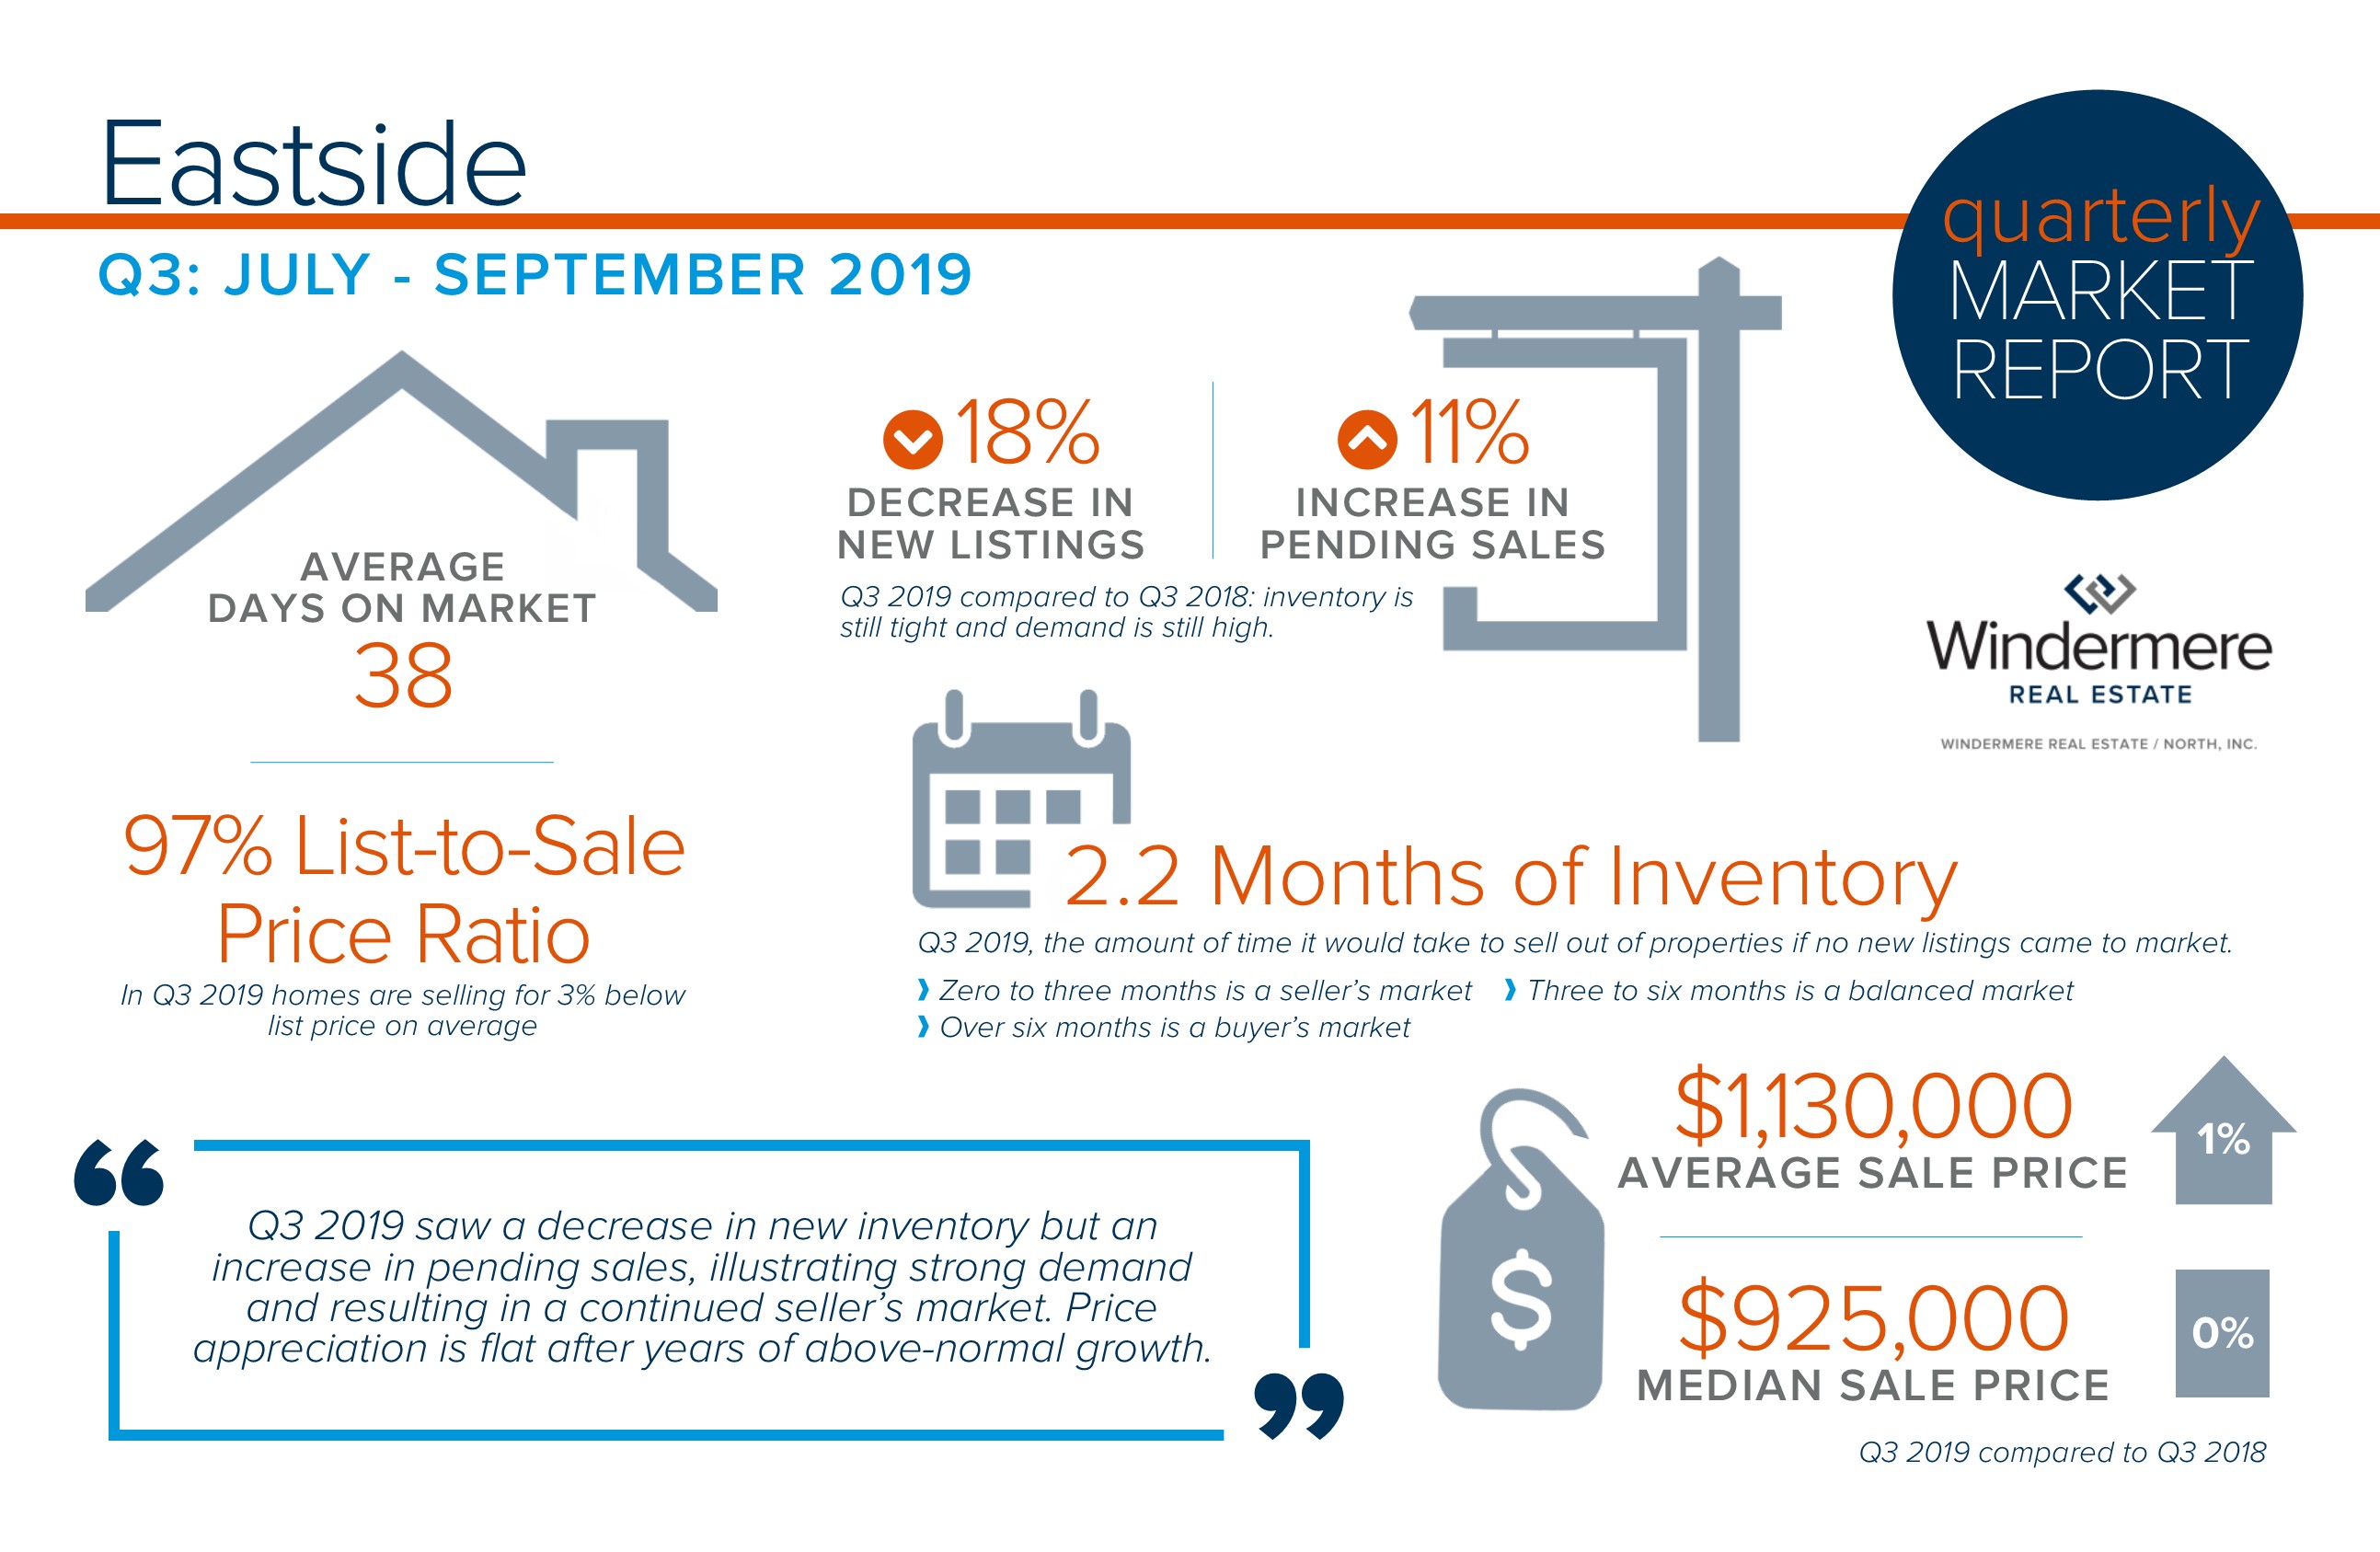
Increased pending activity is an indication of strong buyer demand which is very much being driven by historically low interest rates, a thriving job market, and an overall strong local economy. In fact, interest rates are an entire point lower than they were a year ago! This affords buyers a price point that is 10% higher over last year while maintaining the same monthly payment. A year ago, the monthly payment for a home at $900,000 is the same for a home at $990,000 today. Today’s rates coupled with tempered price appreciation provides increased affordability for buyers, which in turn is providing a healthy audience for sellers. After many years of strong price increases, many sellers are moving their equity to the next lifestyle home they desire.
This is only a snapshot of the trends on the Eastside; please contact me if you would like further explanation of how the latest trends relate to you.

 Facebook
 X
X
 Pinterest
 Copy Link